
The Versus Baseline functionality shows statistical variation, measured in Z-Scores, in the EEG data relative to baseline values.
The Versus Baseline (VsBaseline) trends allow the user to compare data with baseline data from the patient in order to make it easier to locate potentially significant changes that may take place over long periods of time. Persyst automatically maintains baseline information between multiple recordings for the same patient, allowing for comparisons across an entire patient stay.
More technically, the VsBaseline FFT Spectrogram displays the normalized z-score versus the empirical null calculated from the baseline selected on the Trend Button Bar. In the example below, the spectrogram separates the EEG data into four quadrants, Left and Right Anterior and Left and Right Posterior, but can be configured by hemisphere, quadrant, or by channel, depending on need. Time is on the x-axis, frequency is on the y-axis and the color on the z-axis are z-scores versus the selected baseline. The two-ended color scale is increasingly red for positive z-scores (a statistical increase in activity compared to baseline) and increasingly green for negative z-scores (a statistical decrease in activity compared to baseline) and white indicates no change compared to the baseline. The baseline is automatically computer-generated or can also be user-defined.
The VsBaseline Trend is useful for detecting and monitoring progressive changes that may not be immediately apparent in the raw EEG signal. Given that Vs Baseline reflects changes relative to the baseline, all interpretations must be done in consideration of patient state when the baseline was set.
The image below is from an EEG file recorded during a carotid endarterectomy (CEA) procedure where plaque buildup is removed from inside a carotid artery in the neck. EEG and Evoked Potential (EP) recordings are useful in monitoring for changes in the raw waveforms that could indicate ischemia and other important events during the procedure. While the changes seen in the raw EEG and EP waveforms are useful, the most important question the clinician must answer is how much change has occurred since the beginning of the procedure. Such progression over time can be difficult to assess, particularly if the change is subtle. Statistical measures, such as the VsBaseline Trend, quantify exactly how much the EEG signal has changed at a given time point in the recording compared to the designated baseline period.
During the 30 min time period the Trends show in the image below, the black arrows mark the time point where the left carotid was clamped in preparation to insert a shunt. The EEG page shows several seconds of data less than a minute after the clamp was placed where the asymmetry between the left and right hemispheres is seen, however exactly to what extent compared to the patient’s baseline is not known from the raw signal alone.
With the VsBaseline Trend, these changes are quantified, showing a significant loss of activity in the left anterior and posterior quadrants immediately after clamping by about 13 z-scores. The initial loss in the first minute involves the beta/alpha range, soon followed by further loss in the theta range and finally delta as well, all occurring within two minutes post-clamp.
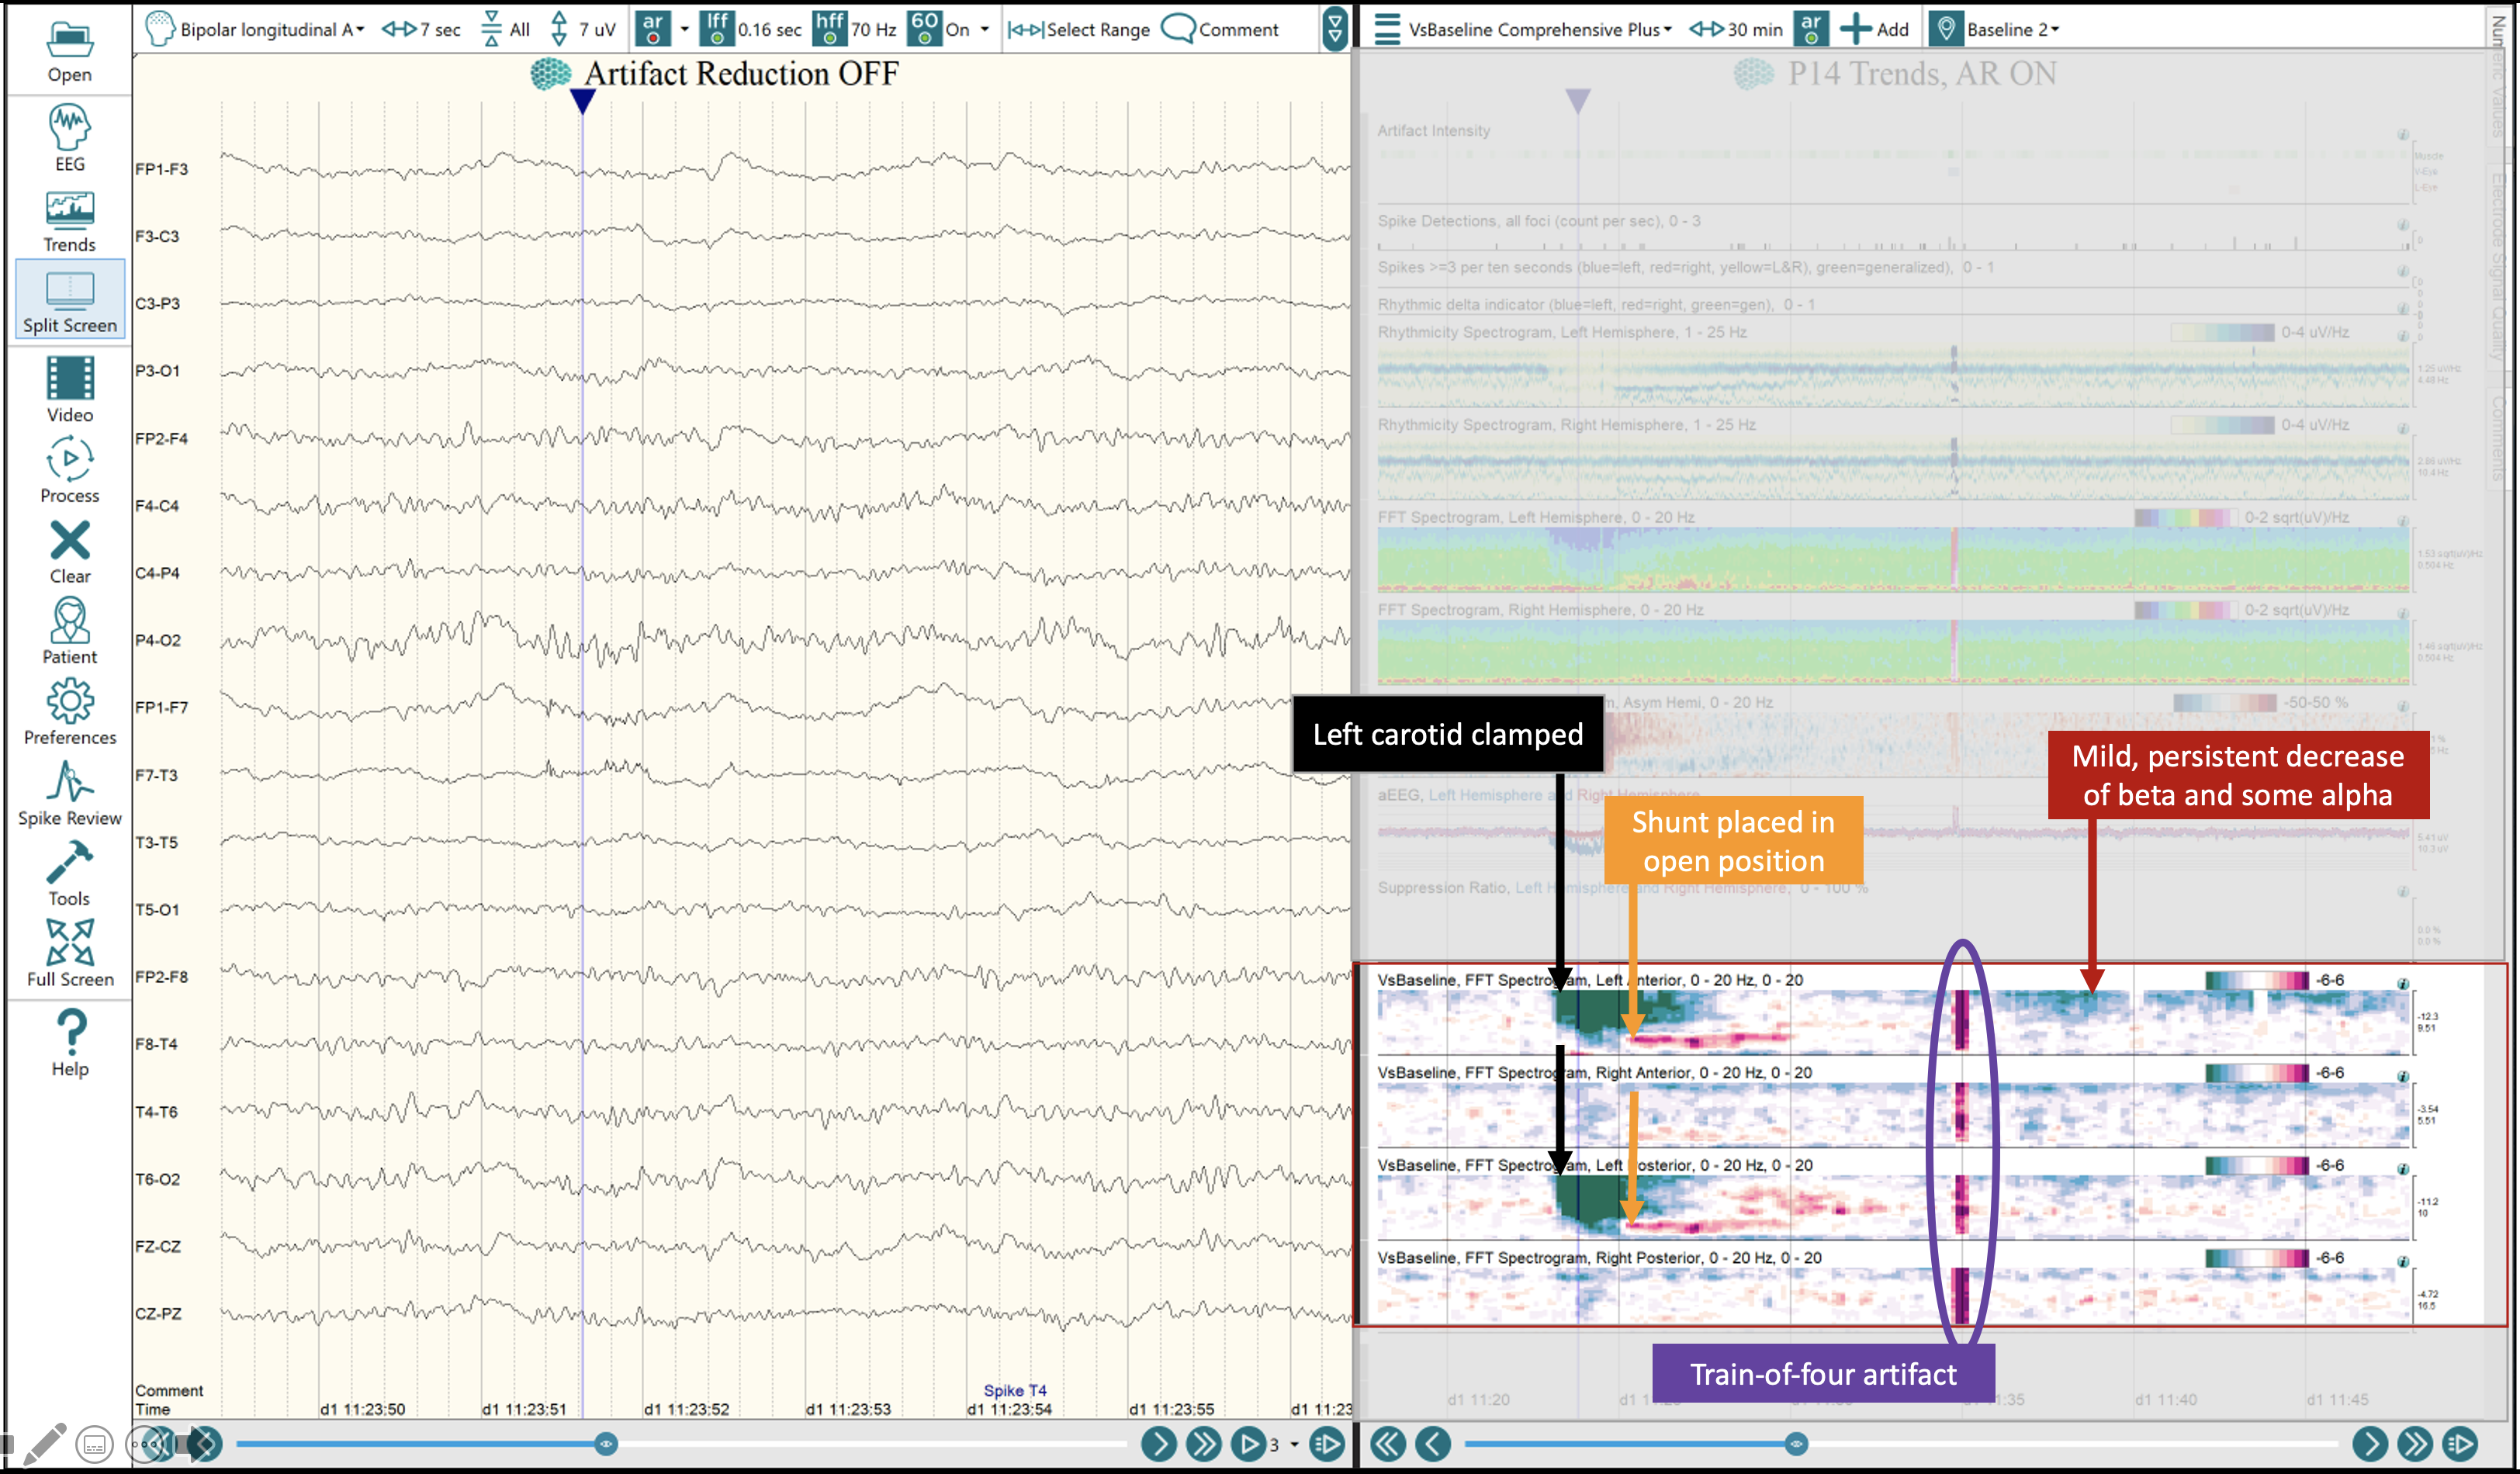
The orange arrows indicate the moment the shunt was placed in the open position where the ischemic effects begin to reverse with an increase by about 10 z-scores in activity in the delta range (reactive slowing), as seen by the pink.
The reactive slowing slowly abates over the next four minutes, as the rest of the EEG returns to near-baseline. Then later, at the red arrow, we see a mild, persistent loss of beta and some alpha developing over time.
Finally, the short and sudden increase in activity across all four quadrants, as indicated by the purple circle, is due to artifact from a “train-of-four” peripheral nerve stimulator test that was performed on the patient during the procedure to assess the quality of the neuromuscular blockade. The EEG time point corresponding to when the test was given is seen below.
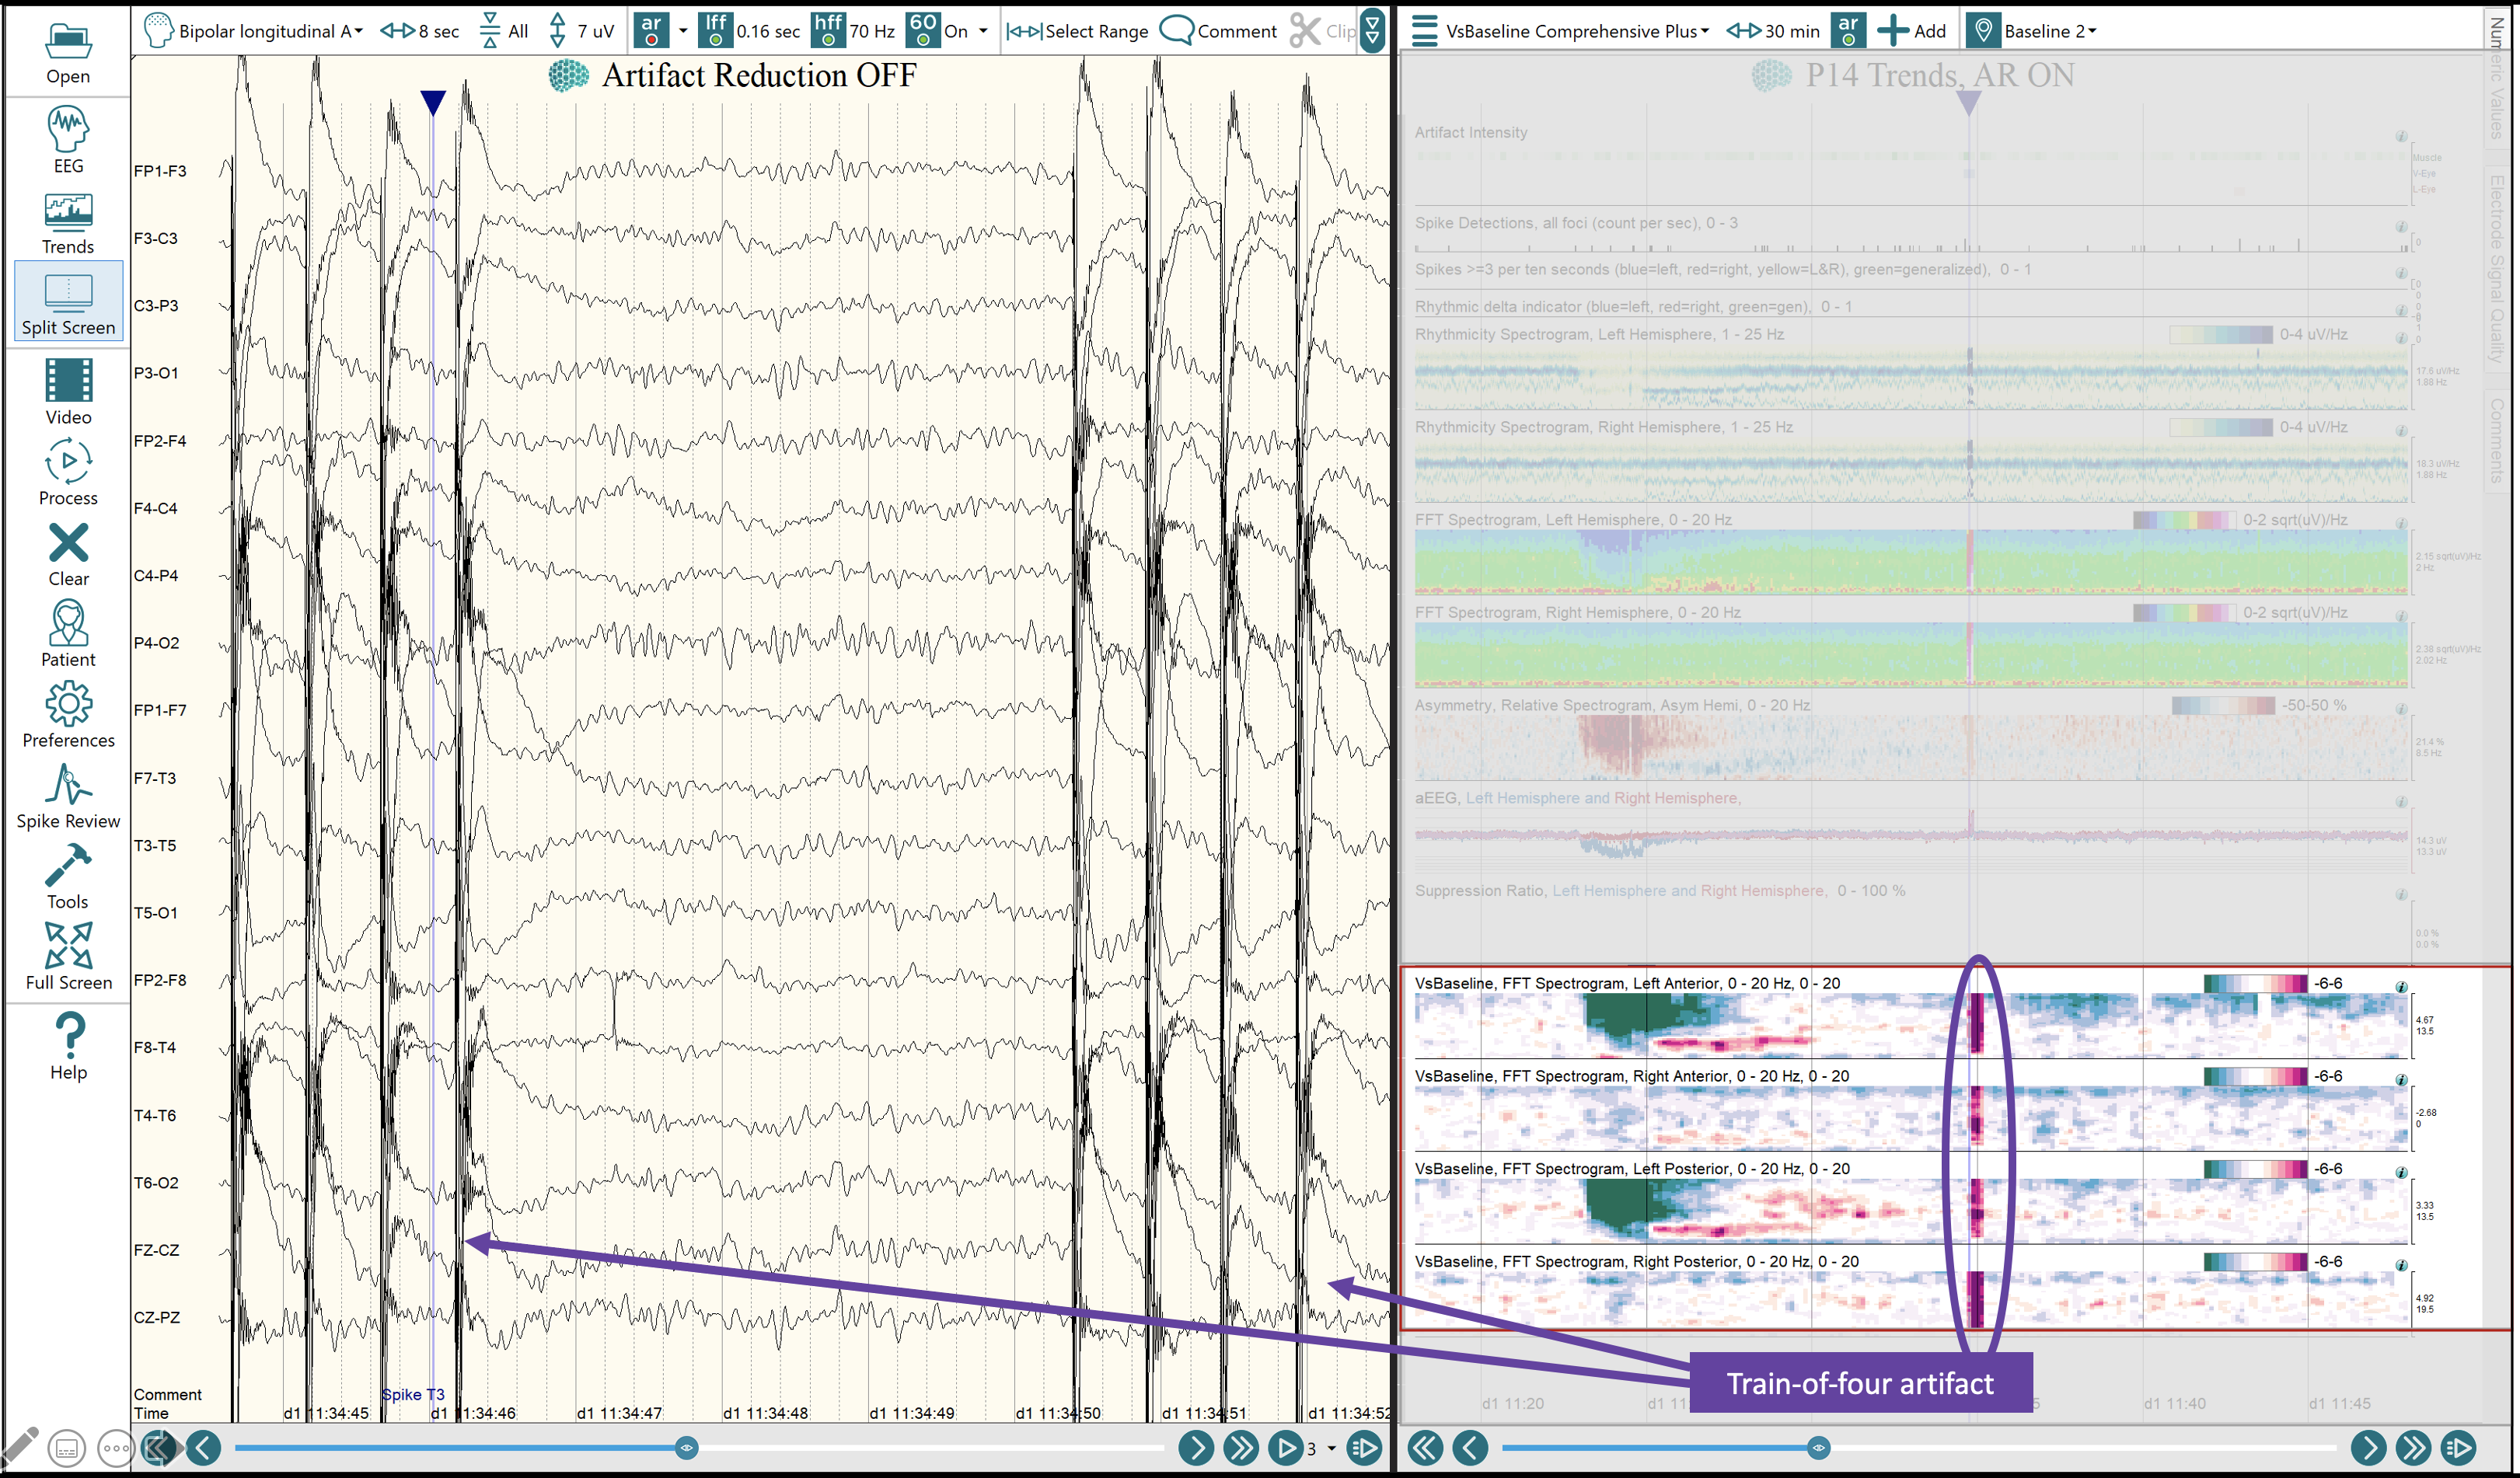
“Train-of-four” artifact seen in the EEG and the Trends.