Spike Review summarizes detections
While the Spike Detection and Density Trend shows the presence of spikes throughout the recording over time, reviewing the individual spikes is still quite burdensome if many need to be inspected and mentally classified.
Persyst Spike Review optimizes this process through automatically clustering spikes according to the electrode of maximal amplitude and providing an overview to the user. The Overview window depicts averages from the various spike foci detected by Persyst’s Spike Detector. To create these overview averages the spike detections are sorted by detection foci (electrode) and then all detections at a particular focus are mathematically averaged. Each EEG column represents a distinct group average. The primary electrode focal point of each average, and the number of detection events incorporated into each average, are shown above the columns of EEG.
Clicking on a cluster will display the raw (non-averaged) spike detections that make up the average. Users can create customized selections of spikes and compare the voltage topography of the selected average against the cluster average. Propagation maps and waveform overlays can also be used to assess morphology and goodness of fit. Users can hand select spikes from within the cluster for further analysis or export, or to confirm as candidates for EEG Source Imaging through Persyst ESI.
")
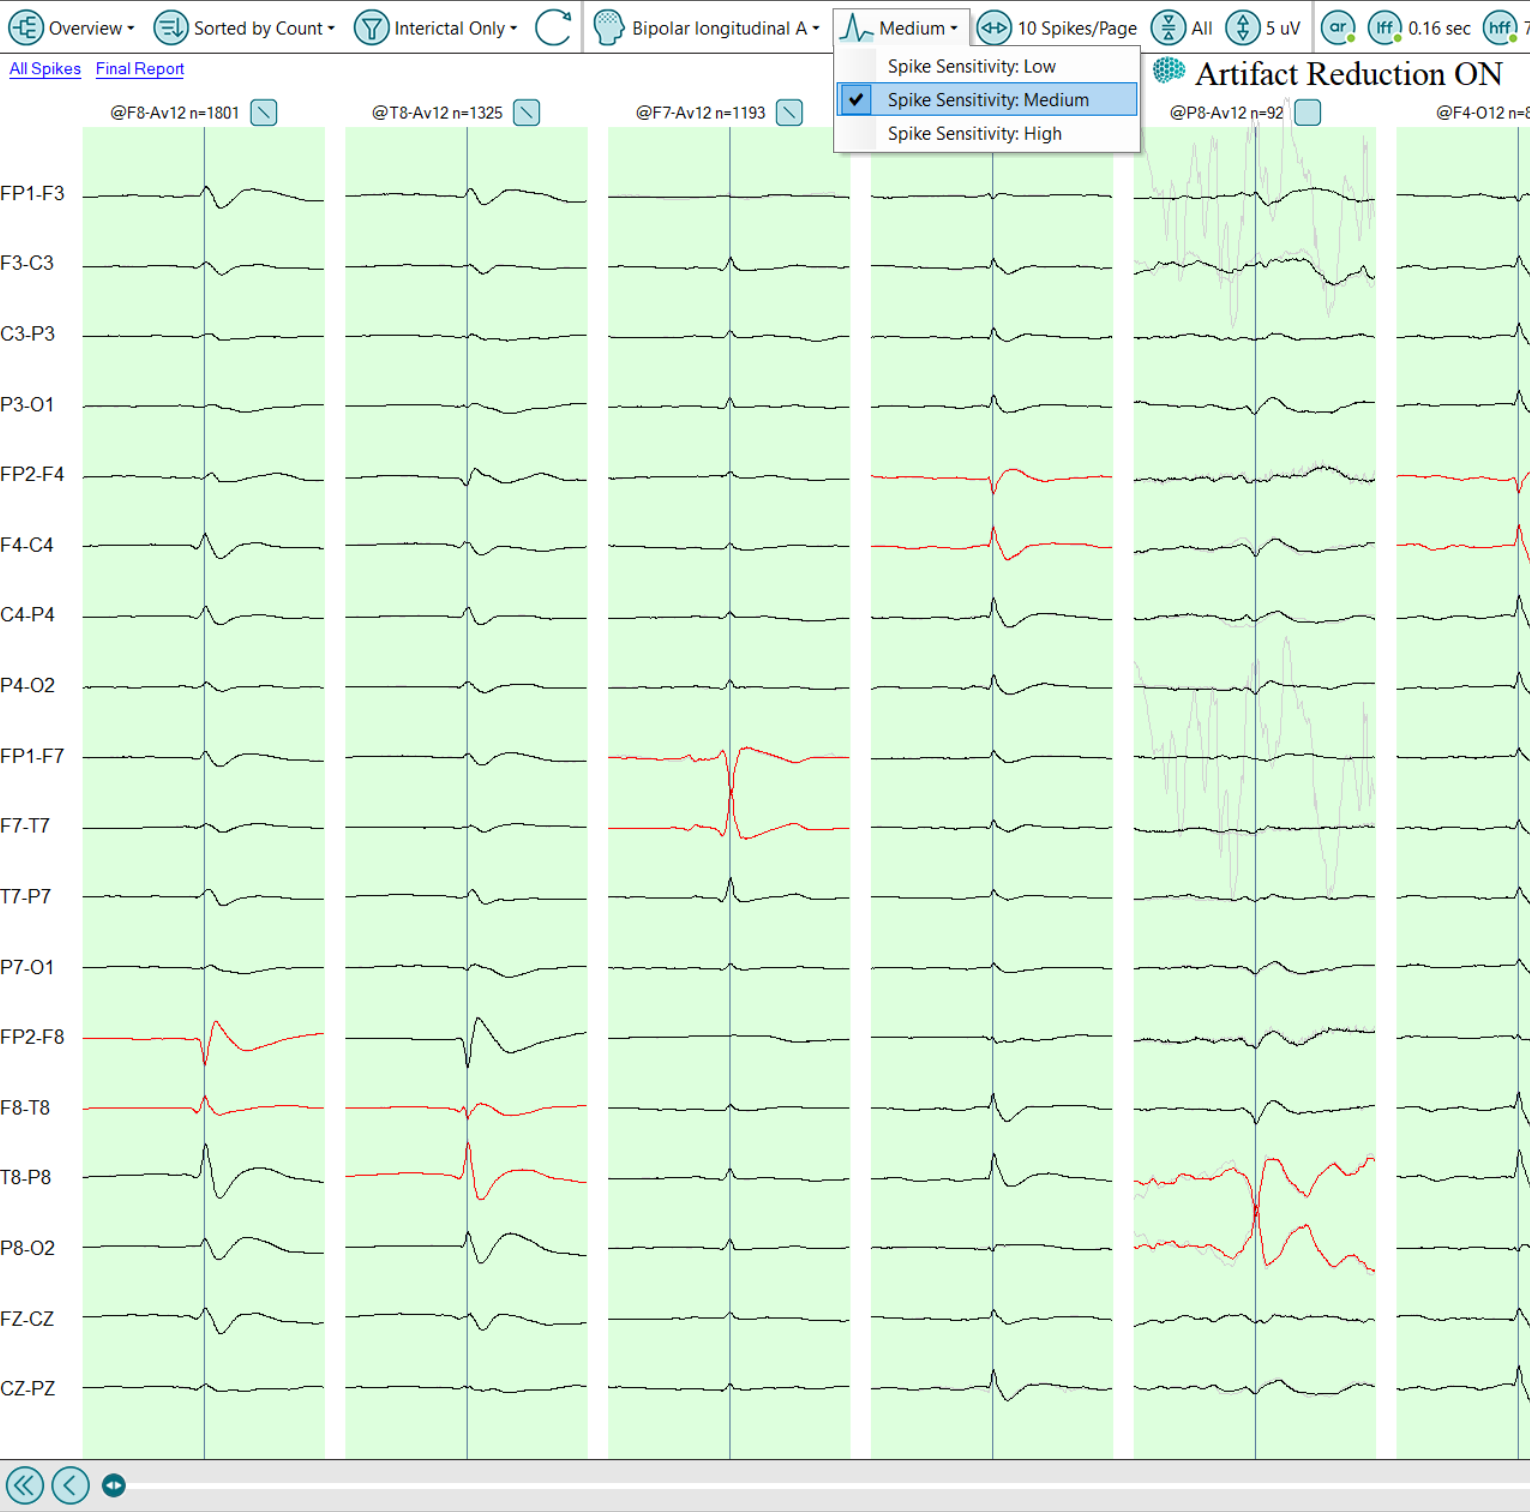
Spike Review showing the Spike Overview, summarizing the spike clusters that were detected by Persyst according to the electrode of maximal activation.
")
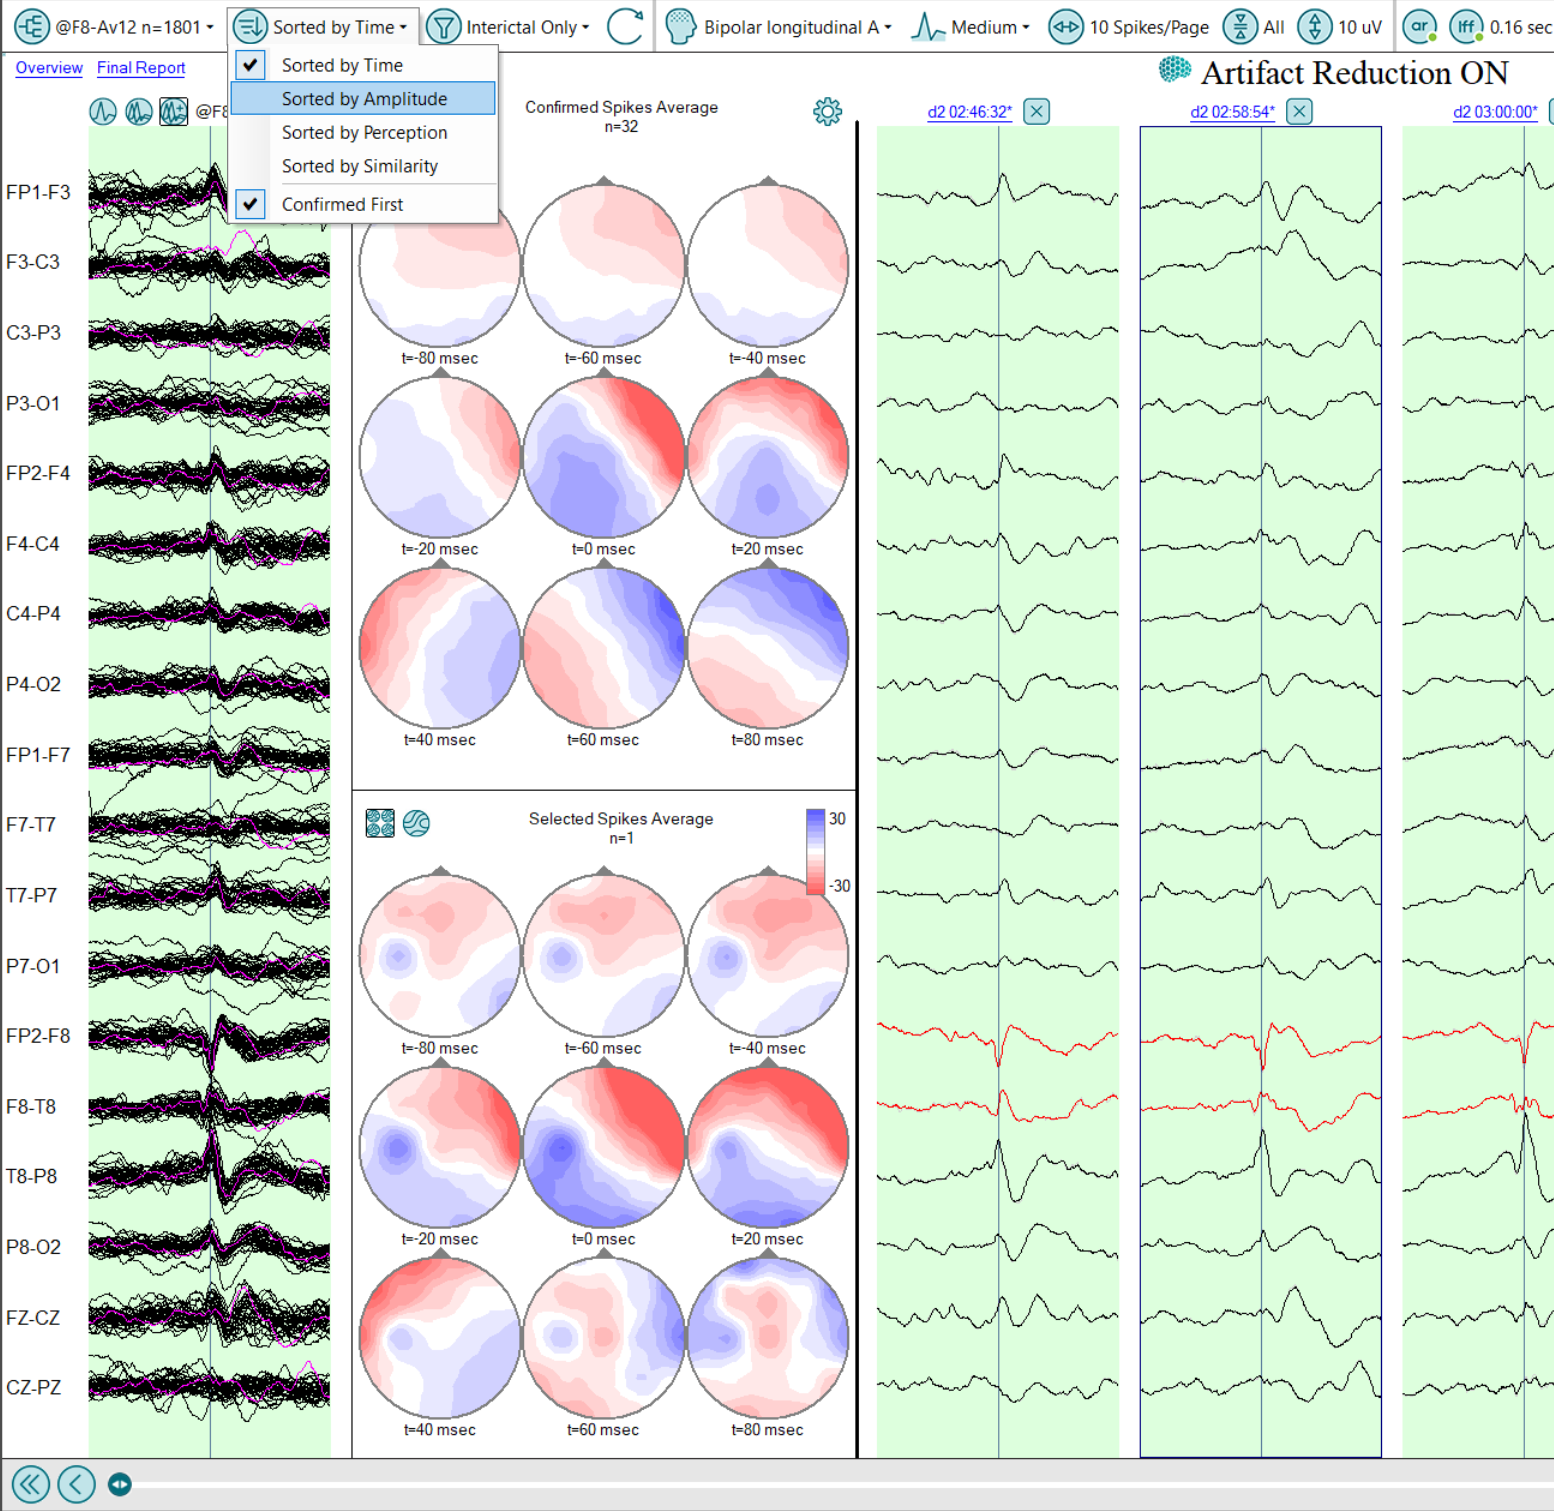
Spike Review with a closer look at the 1801 individual spike candidates within the F8 cluster. Of the 1801 spikes, the user has Confirmed 32 of them and Selected one. On the far left of the Spike Review window, the waveforms of the 32 Confirmed spikes are drawn as an overlay and appear in black. The one Selected spike is also in pink and overlaid on the 32 Confirmed spikes to assess morphology and goodness of fit. The propagation map of the average of the 32 Confirmed spikes is on top. For comparison, the propagation map of the one Selected spike is on the bottom. The individual spike waveforms following have been sorted to show Confirmed first.
Dynamic adjustment of detection sensitivity
The sensitivity of the Spike Detector output can be dynamically adjusted during the review process. When Spike Review is initially opened, the detection sensitivity is set to Medium, which is the default. In this position the Spike Detector neural network algorithms identify sharp transients that have a high probability of being epileptiform abnormalities.
However, some spikes and sharp waves that are less well-formed may not be evident at Medium sensitivity. The detector’s sensitivity can be quickly adjusted on the fly. When set to High, Spike Review shows the results of the detector at this more sensitive setting, which is more likely to identify less well-formed or lower amplitude transients. New groups may then appear in the Overview display of spike averages. In concert with the increase in true spike detections, there is also an increase in false positive detections.
To optimize the review of spikes within a cluster, they can now be sorted by Time, Amplitude, Perception or Similarity. Spikes that have already been Confirmed by the user can also be made to appear first.