
Suppression Ratio displays percentage of EEG suppression
The Suppression Ratio trend displays a running average of the percentage of EEG activity that falls below a user-specified amplitude threshold, as a function of time. Time is displayed on the x-axis and the Suppression Ratio measure (%) on the y-axis, where the blue line represents left hemispheric and the red line represents right hemispheric suppression ratio.
In particular, the Suppression Ratio is a way to quantify and depict suppression patterns in the EEG that may accompany cases of altered brain function in the setting of various pathologies including hypoxic-ischemic injury, ischemia, coma, traumatic brain injury or drug effects (including induction of suppression burst activity for treatment of refractory status epilepticus).
In the case of refractory status epilepticus, the patient is sometimes treated with medications aiming to induce suppression-burst activity in the EEG. In the example below, the patient’s EEG is discontinuous, with bursts of activity separated by periods of suppression.
The Suppression Ratio trend, highlighted on the right side of the image, shows ongoing substantial suppression pattern that lasts for the duration of the one-hour time frame of the Trends view, varying from 15% to 49% suppression.
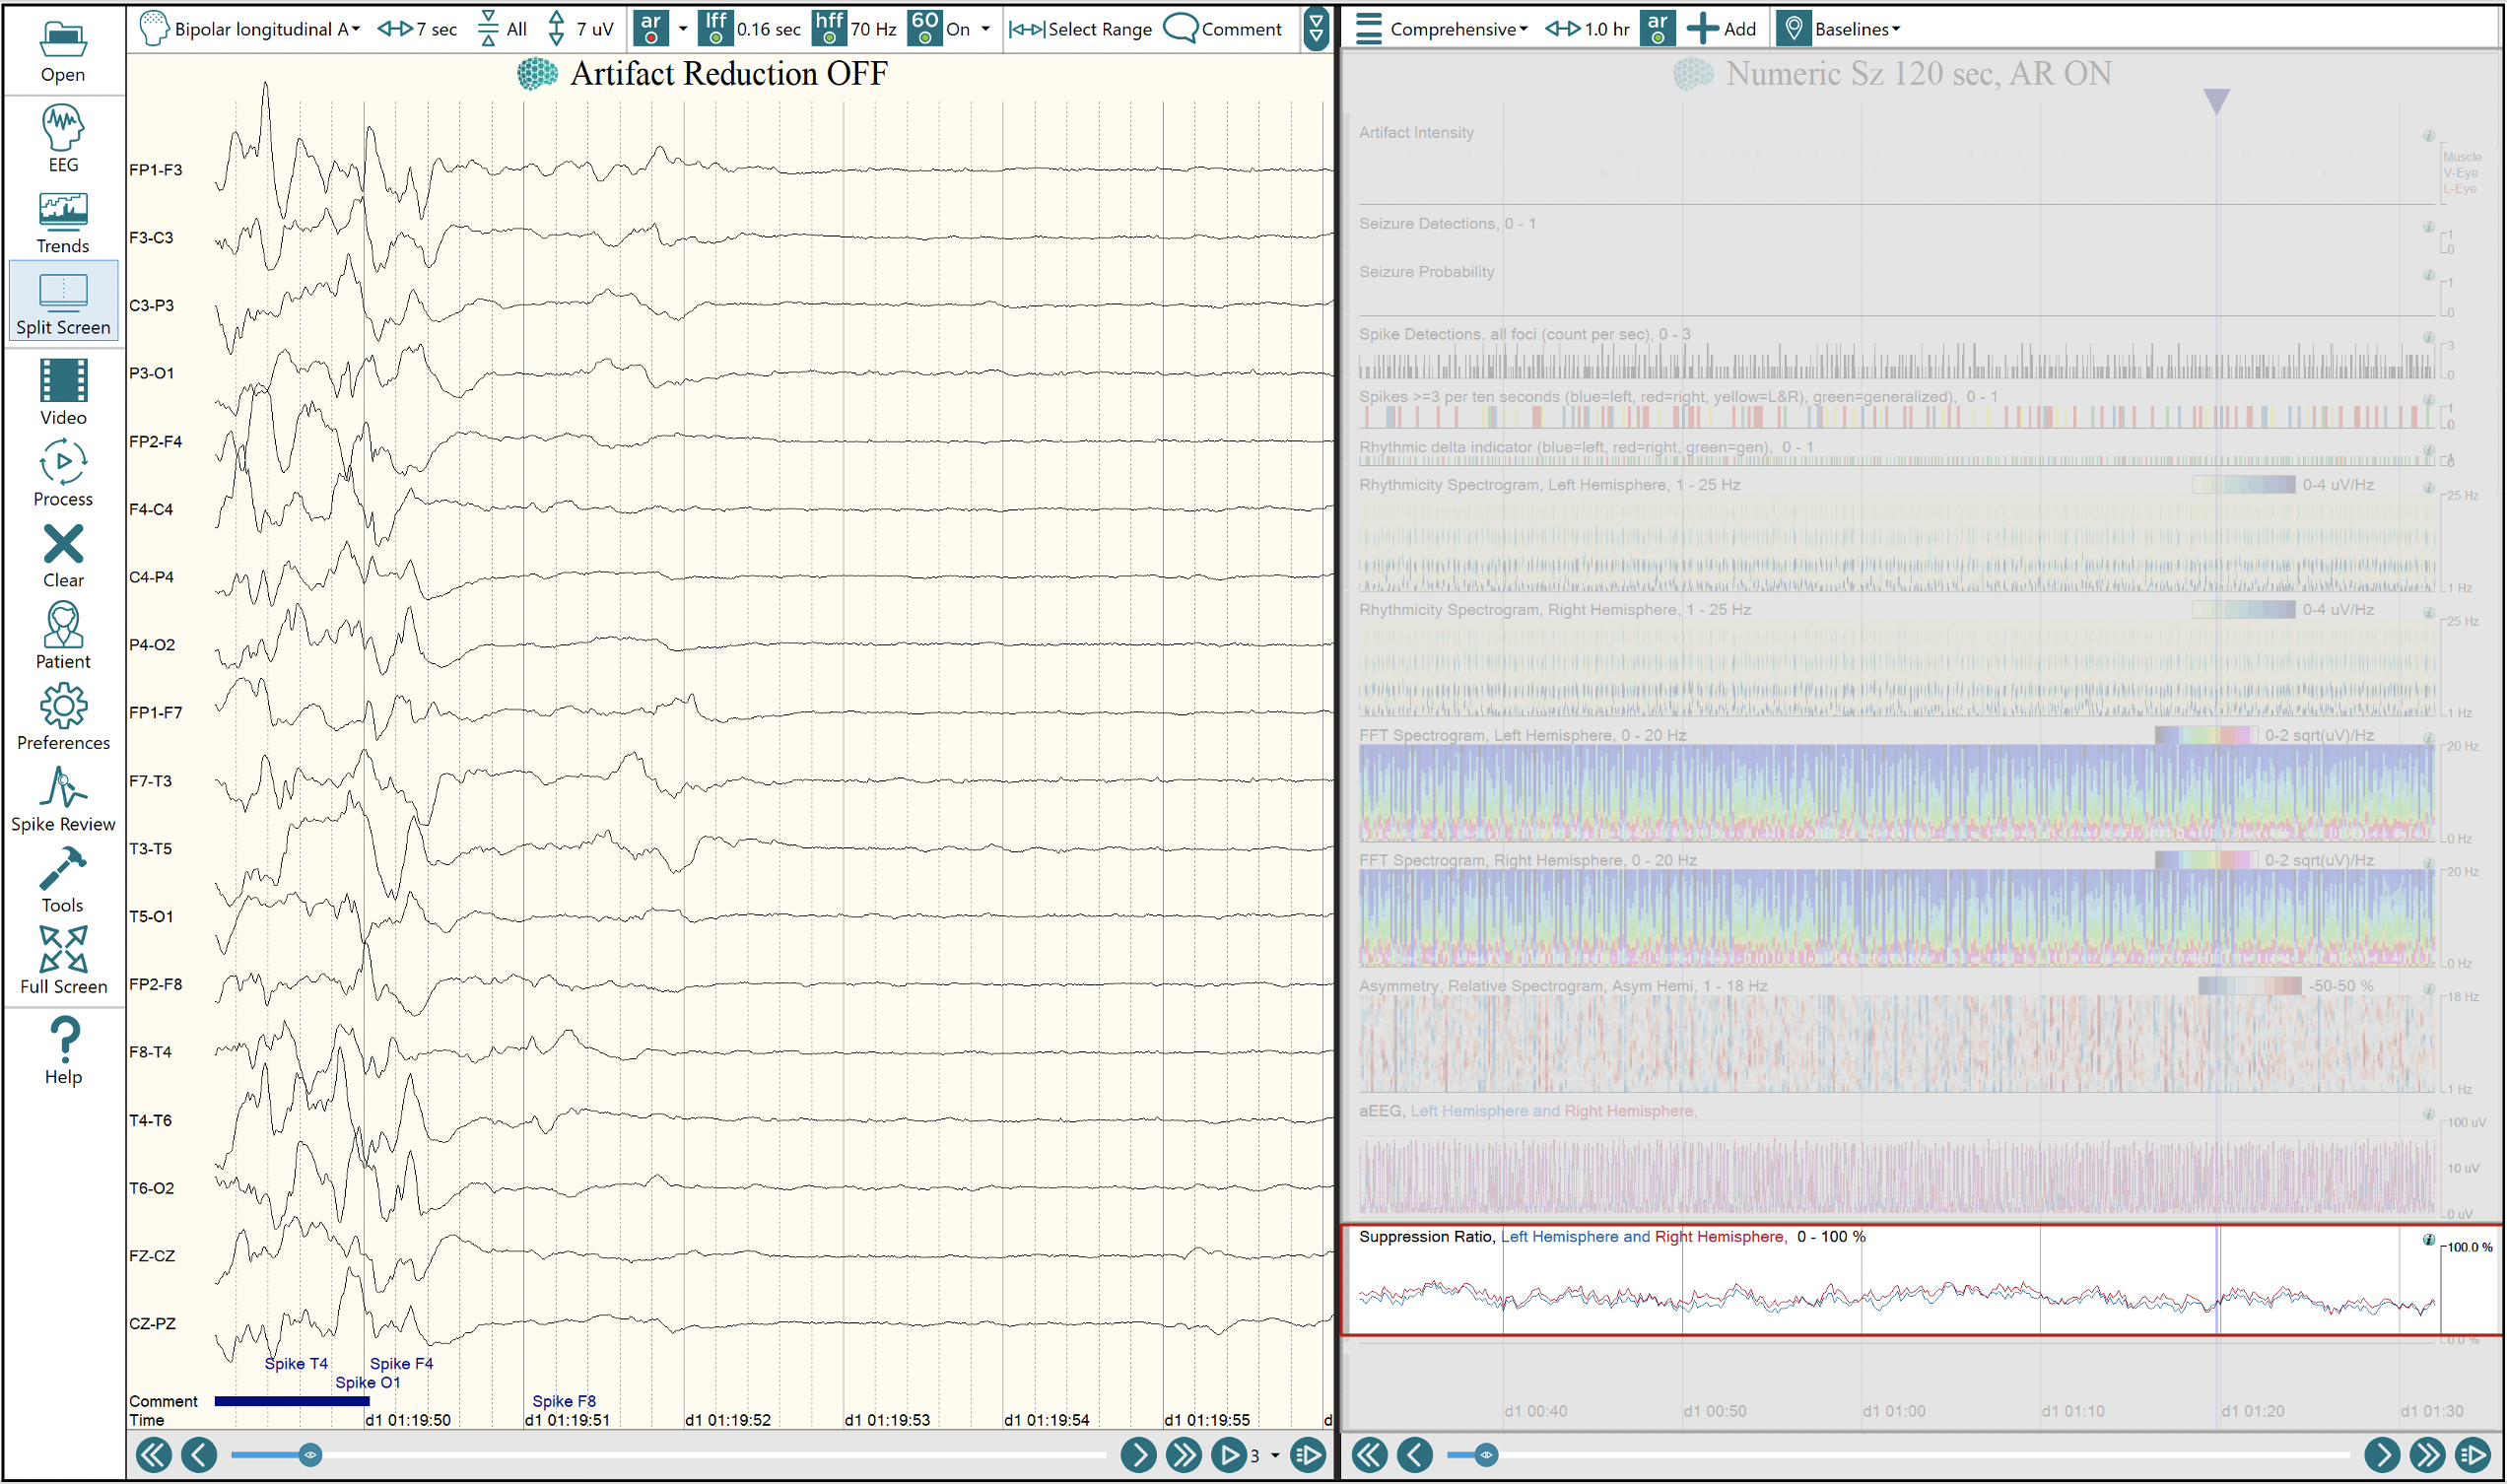
EEG and Trends view with the Suppression Ratio trend highlighted. The EEG signal shows a moment of transition between burst and suppression. A glance at the Trend view reveals that substantial suppression persists for the one-hour window duration. The more suppressed the EEG, the larger the percentage value expressed on the y-axis.