
Spike Detection and Spike Density trends show the presence of spikes throughout the recording as a function of time.
While the Persyst Spike Detection engine itself runs automatically in the background as the EEG recording is being processed, the Spike Detection and Spike Density trends display the results of the detections as a function of time.
Each Spike Event is labeled according to the channel on which it has the highest perception, morphology and field. The Spike Detections, all foci trend shows all spikes regardless of which channel(s) it was detected on. When spikes occur more than 3 times per ten seconds, the Spikes >= per ten seconds trend graphically depicts if they lateralize, where blue is left, red is right, yellow is bilateral and green is generalized.
In the example below, after the seizure occurred, the patient appears to have gone back to sleep, as corroborated by the Artifact Intensity trend. Soon after falling asleep, the patient began generating many left-sided spikes once again.
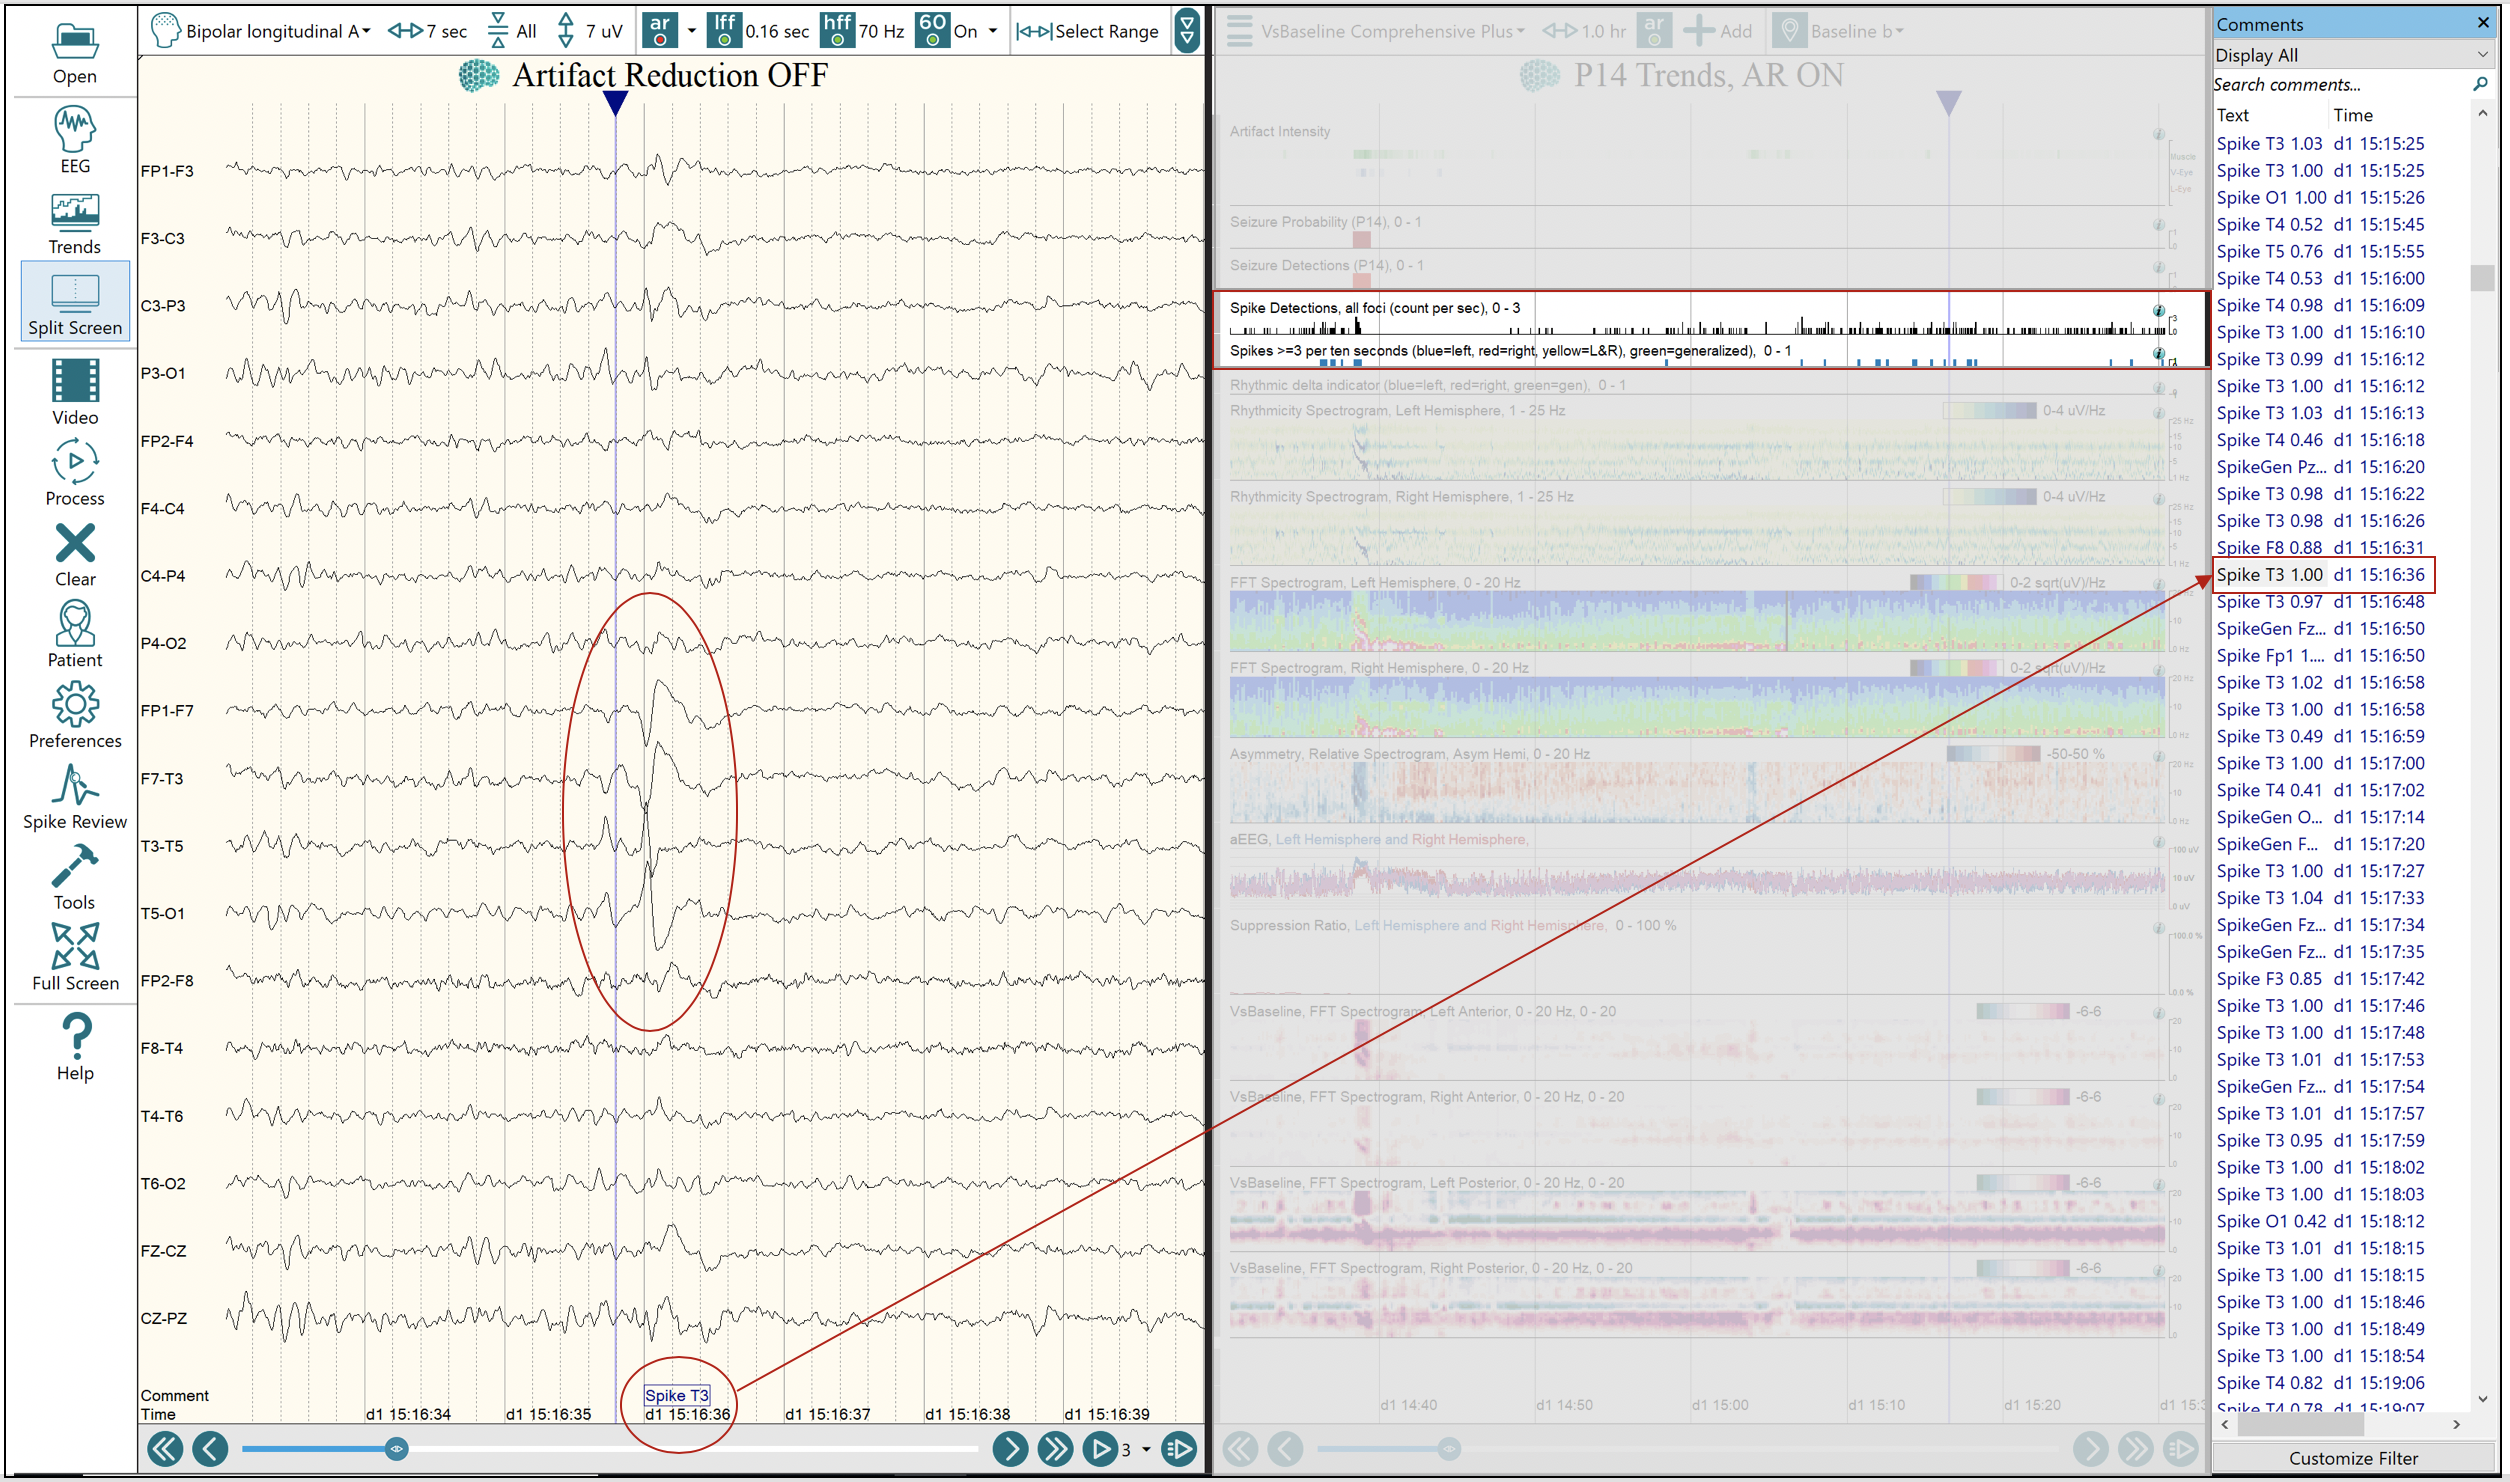
EEG and Trends view where the Trends view shows a one-hour timeframe. The EEG shows one spike occurrence in about seven seconds (circled in red). Whereas in the Spike Density trend, it is immediately appreciated how many spikes this patient is generating over a one-hour time period. Note the Spike text comments seen as a list to the right.