
Seizure Detection and Seizure Probability provide complementary information
The Seizure Probability trend shows a second by second display of the calculated seizure probability for a given EEG segment, expressed as a value ranging from 0.0 to 1.0, where 1.0 is the highest probability of a seizure. Meanwhile, the Seizure Detection trend raises a notification to the user, in the form of a seizure event, when the EEG data surpass the user specified threshold for a seizure.
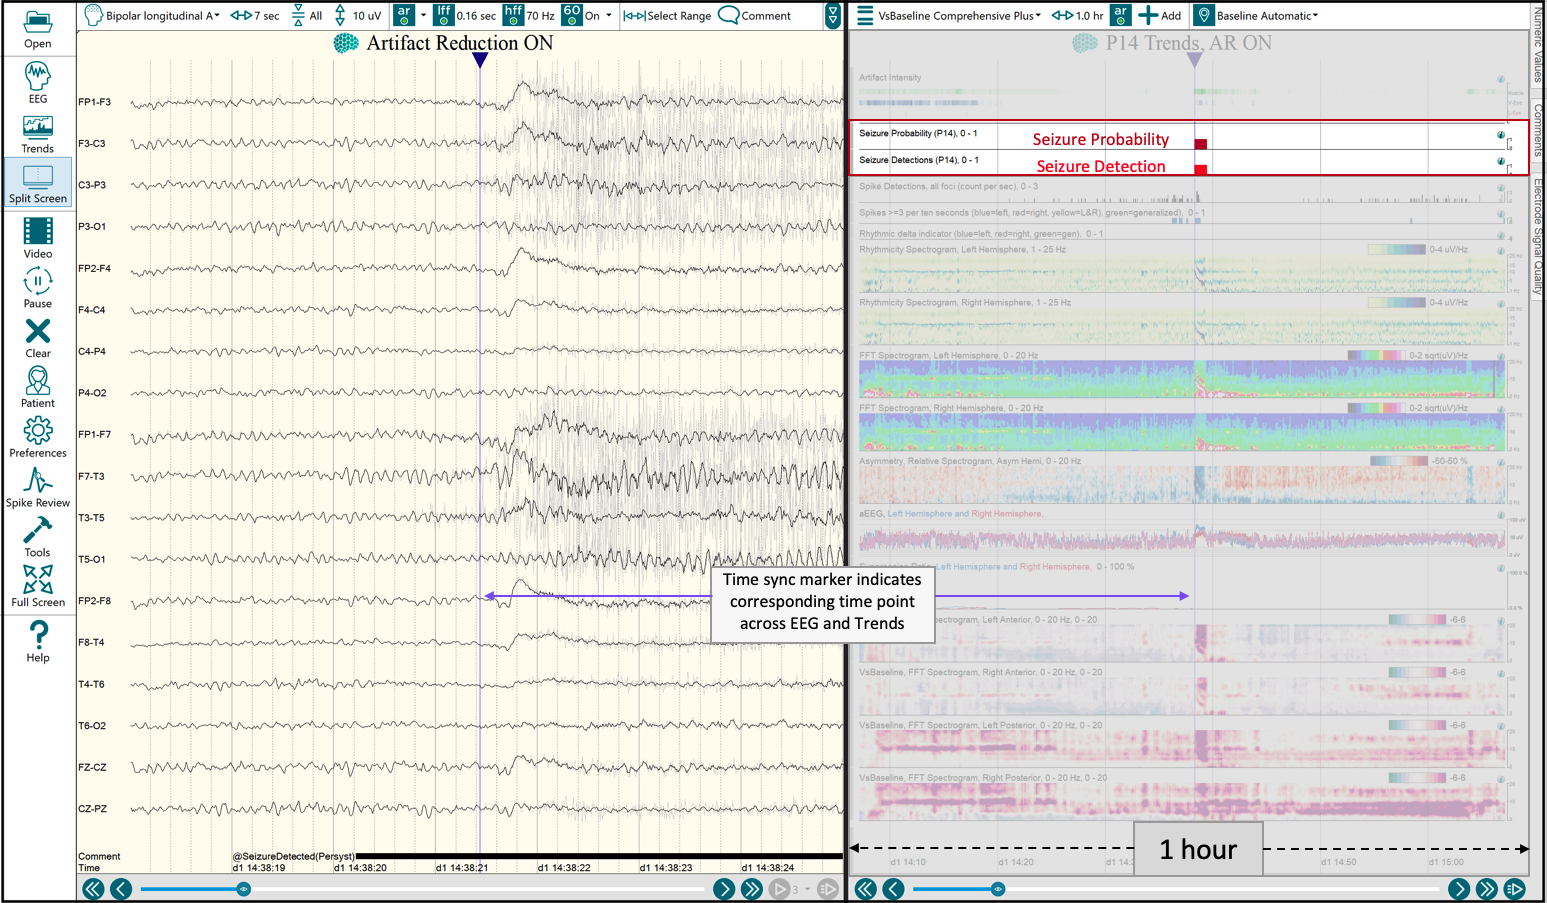
In this example, a seizure event was raised within the one-hour timeframe visible in the trends. The seizure event is indicated by the bright red mark. The calculated probability that these seizure events were true seizures is also quite high (around 1.0), indicated by the darker red marks, raising the overall confidence of the event being a true positive.
With the Trends providing a summary review of the data, the user can immediately see when a seizure was detected and navigate directly to the corresponding EEG to further inspect the waveforms.
P14 split EEG and Trends view. It is also possible to have EEG-only or Trend-only views.