
The Rhythmicity Spectrogram reveals rhythmic components in the EEG
Rhythmicity and sharpness in the EEG are among the strongest predictors of epileptic seizures when interpreting an EEG file. Until Persyst developed the Rhythmicity Spectrogram, there was no way to quantitatively assess rhythmic components within EEG frequency bands.
The Rhythmicity Spectrogram trend displays a density spectral array of frequency and power characteristics of the EEG, derived from a multistage autocorrelation function, as a function of time. Time is displayed on the x-axis, frequency on the y-axis, and a measure of EEG power on the z-axis as a color scale. The Rhythmicity Spectrogram provides a graphical depiction of the amplitude of primary rhythmic EEG components present in four frequency bands spanning 1-25 Hz.
Seizures often appear as a diagonal line or triangle-shaped lines that are darker in color, reflecting the fact that many seizures begin at faster frequencies and then gradually slow over the course of the seizure.
The Rhythmicity Spectrogram can be configured by hemisphere, or by channel, depending on how granular the need. In the example below it is configured by hemisphere, where the left hemisphere is on the top, and the right is on the bottom. At the point where the seizure is detected, the Rhythmicity Spectrogram shows a diagonal line angling downwards between 10 and 5 Hz on the left side. A diagonal line is also seen going downwards in the 5 Hz range on the right side. This indicates the rhythmicity correlated with the detected seizure is more prevalent on the left, moving from faster to slower frequencies.
Note the time point of the EEG does not correlate to the time of the detected seizure. With the one-hour Trends view next to the EEG, it can be quickly understood that about 20 minutes later in this recording a seizure was detected. A reviewer can quickly navigate to that time point for further in-depth analysis.
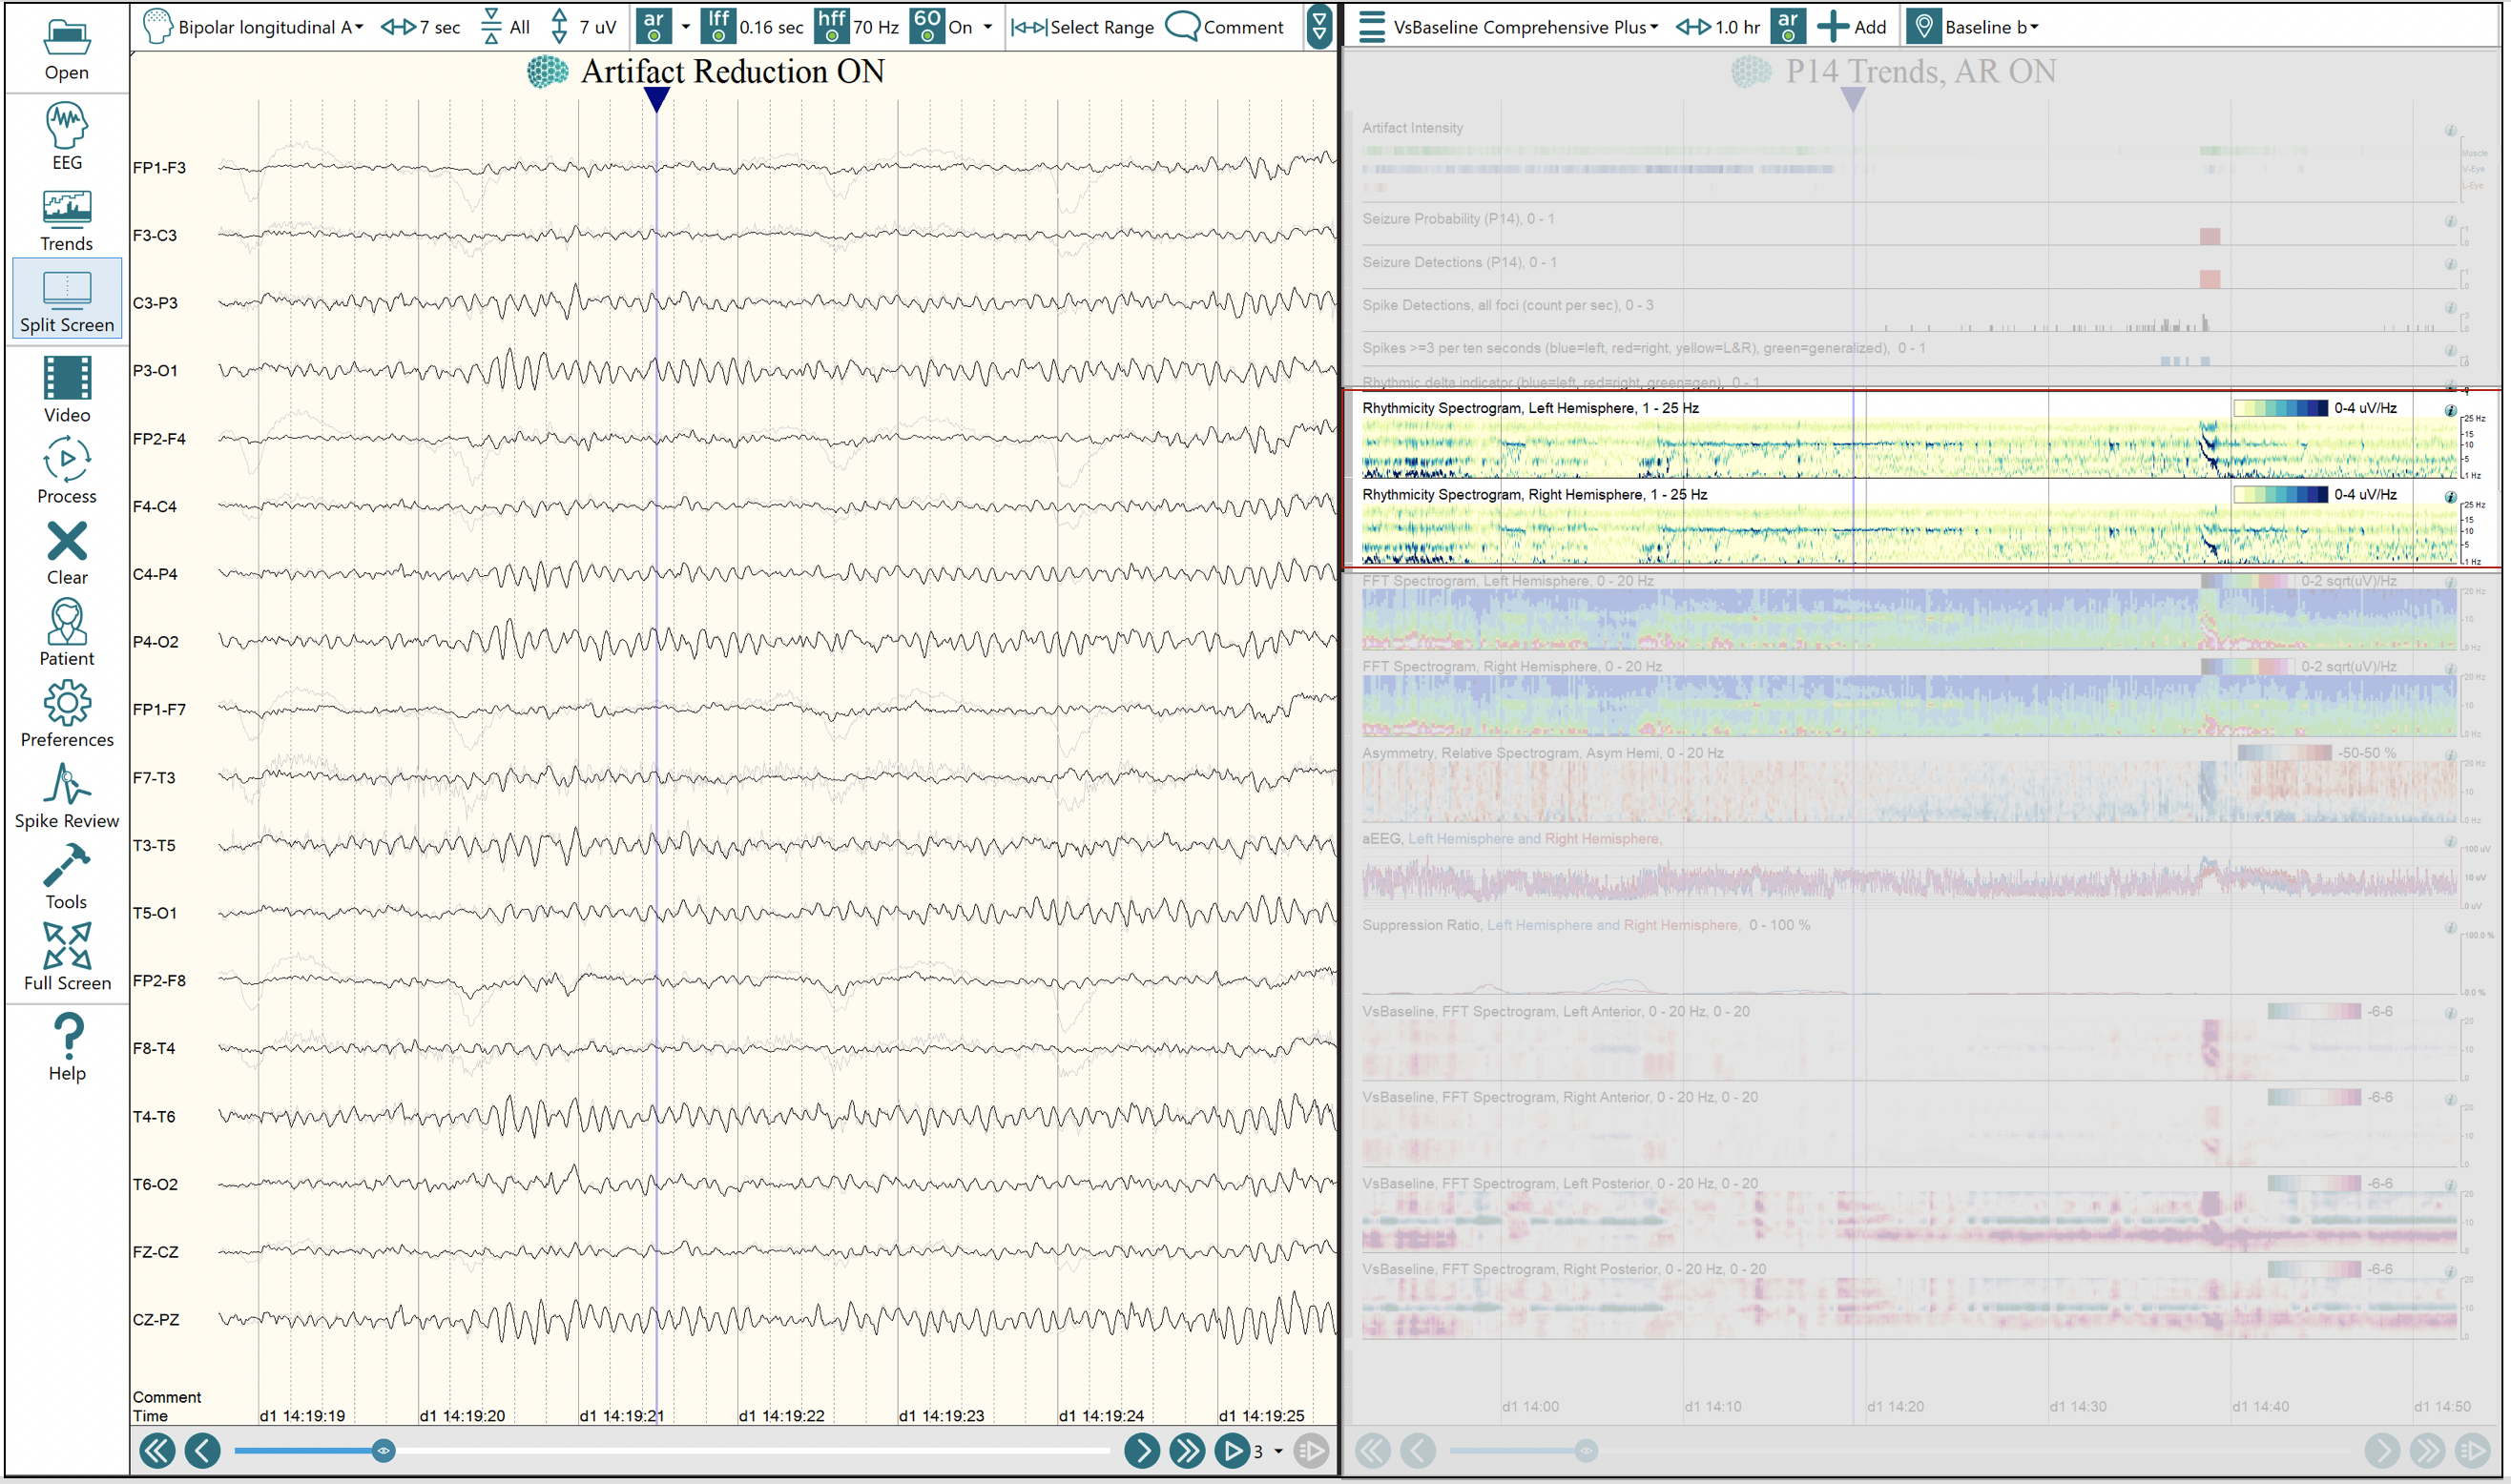
The Rhythmicity Spectrogram is divided into hemispheres with the left hemisphere on the top and the right hemisphere on the bottom. In this example, the Rhythmicity Spectrogram shows that a seizure was detected about 20 min later from time point the EEG is reflecting. With the combination of both the EEG and Trends in view, the user can efficiently navigate to areas of interest within the recording for more detailed review.