
Asymmetry Spectrogram shows relative power asymmetry between hemispheres
The Relative Asymmetry Spectrogram trend, using a density spectral array, displays a relative comparison of the power values of EEG data in homologous (left- and right-side position-mirrored) scalp electrodes, for each FFT frequency bin derived from a fast Fourier transform analysis, as a function of time. Time is displayed on the x-axis, frequency on the y-axis, and a measure of relative EEG power for the user-specified channel(s) on the z-axis as a color scale where red is the right hemisphere and blue is the left.
In the example below, the Relative Asymmetry Spectrogram shows a gradual increase in left-sided activity relative to the right leading up to the seizure detection. At the time point the seizure is detected, there is a sudden increase in blue across all frequencies, to reflect increased activity in the left hemisphere. Immediately following the seizure, the left hemispheric activity is attenuated in the 10 to 20 Hz range relative to the right hemisphere, explaining why the spectrogram is red in this range for this time point. Simultaneously, the presence of slow activity on the left hemisphere in the 1 to 3 Hz is intensified relative to the right, explaining why the spectrogram is blue in the lower frequency range at this time point.
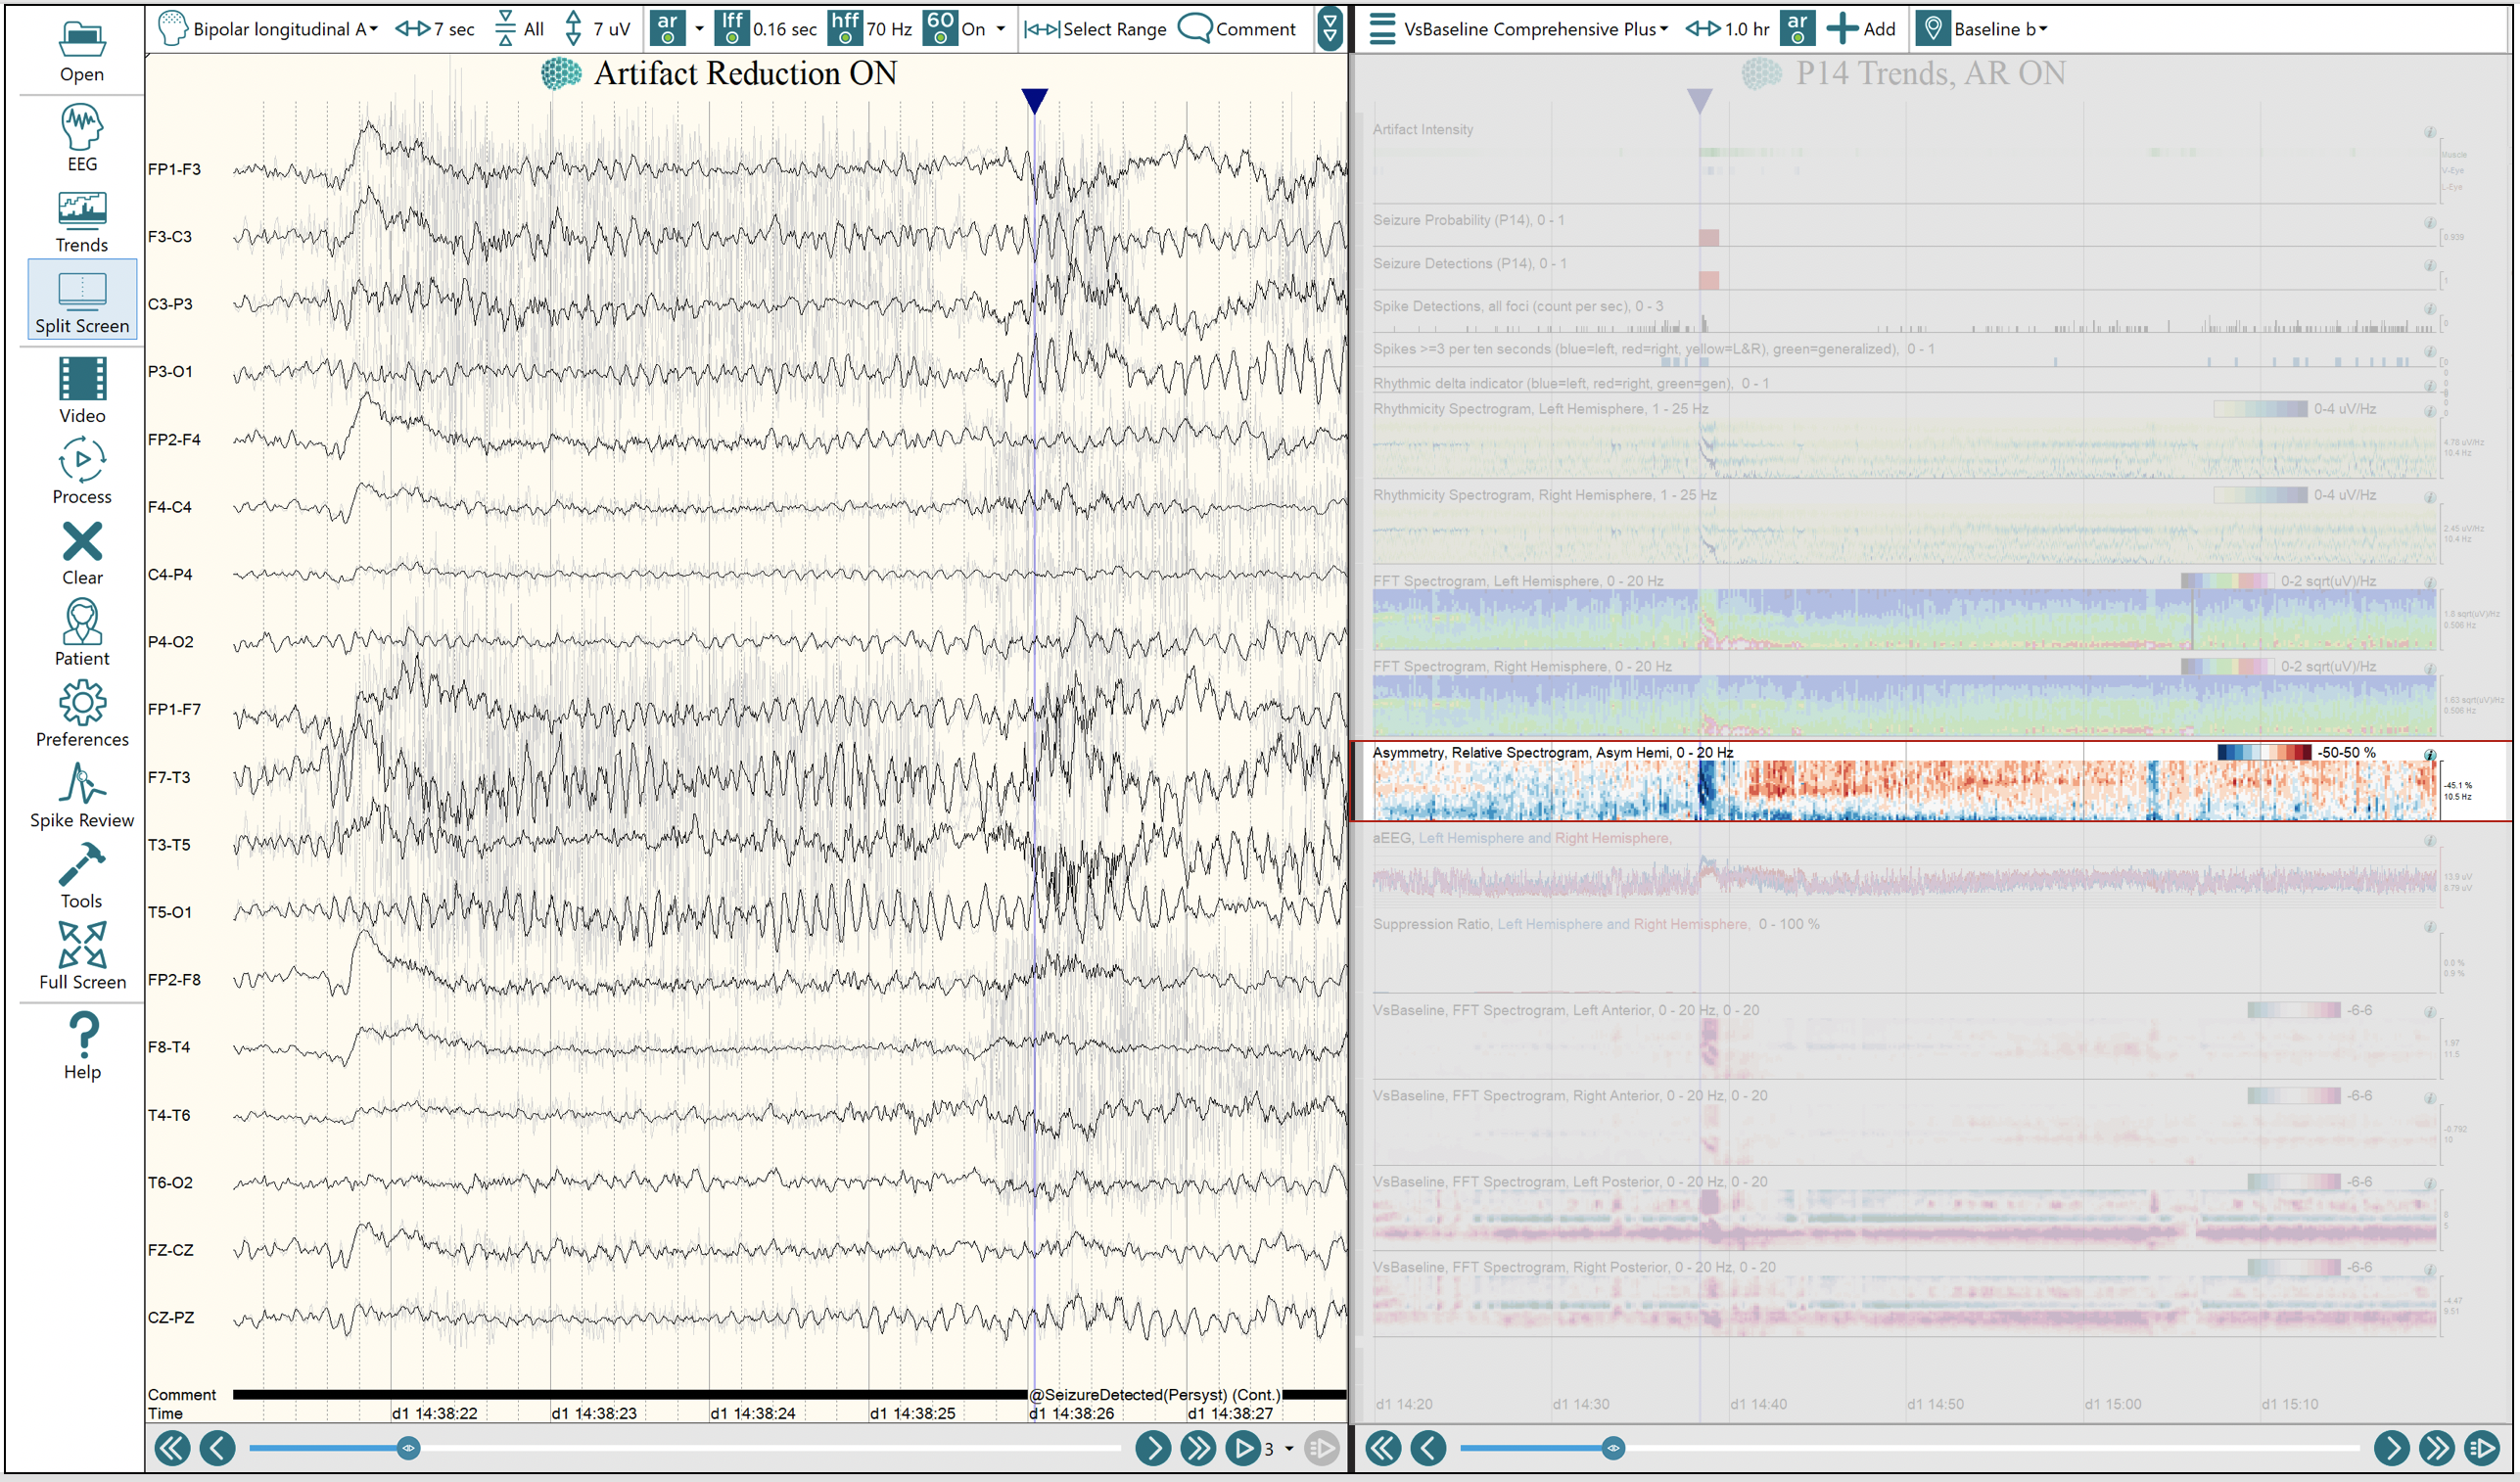
EEG and Trends view with the Relative Asymmetry Spectrogram highlighted. The EEG signal shows the onset of the seizure detection, while the trends view spans one hour of the recording.