
FFT Spectrogram reveals the power of each spectral component in the EEG
The FFT Spectrogram trend, sometimes known as a color density spectral array (CDSA), displays a density spectral array of the frequency and power characteristics of the EEG, derived from a fast Fourier transform (FFT) analysis, as a function of time. Time is displayed on the x-axis, frequency on the y-axis, and a measure of EEG power on the z-axis as a color scale. In the Persyst FFT Spectrogram, cooler colors (blue and green) represent low power and warmer colors (white, red and yellow) represent high power.
Seizures often manifest as an increase in frequency and amplitude compared to the patient baseline and then gradually slow as it progresses. In the example below, the detected seizure correlates with a transient increase in power in the 1 to 8 Hz frequency range, represented by the white and red colors with left being greater than right.
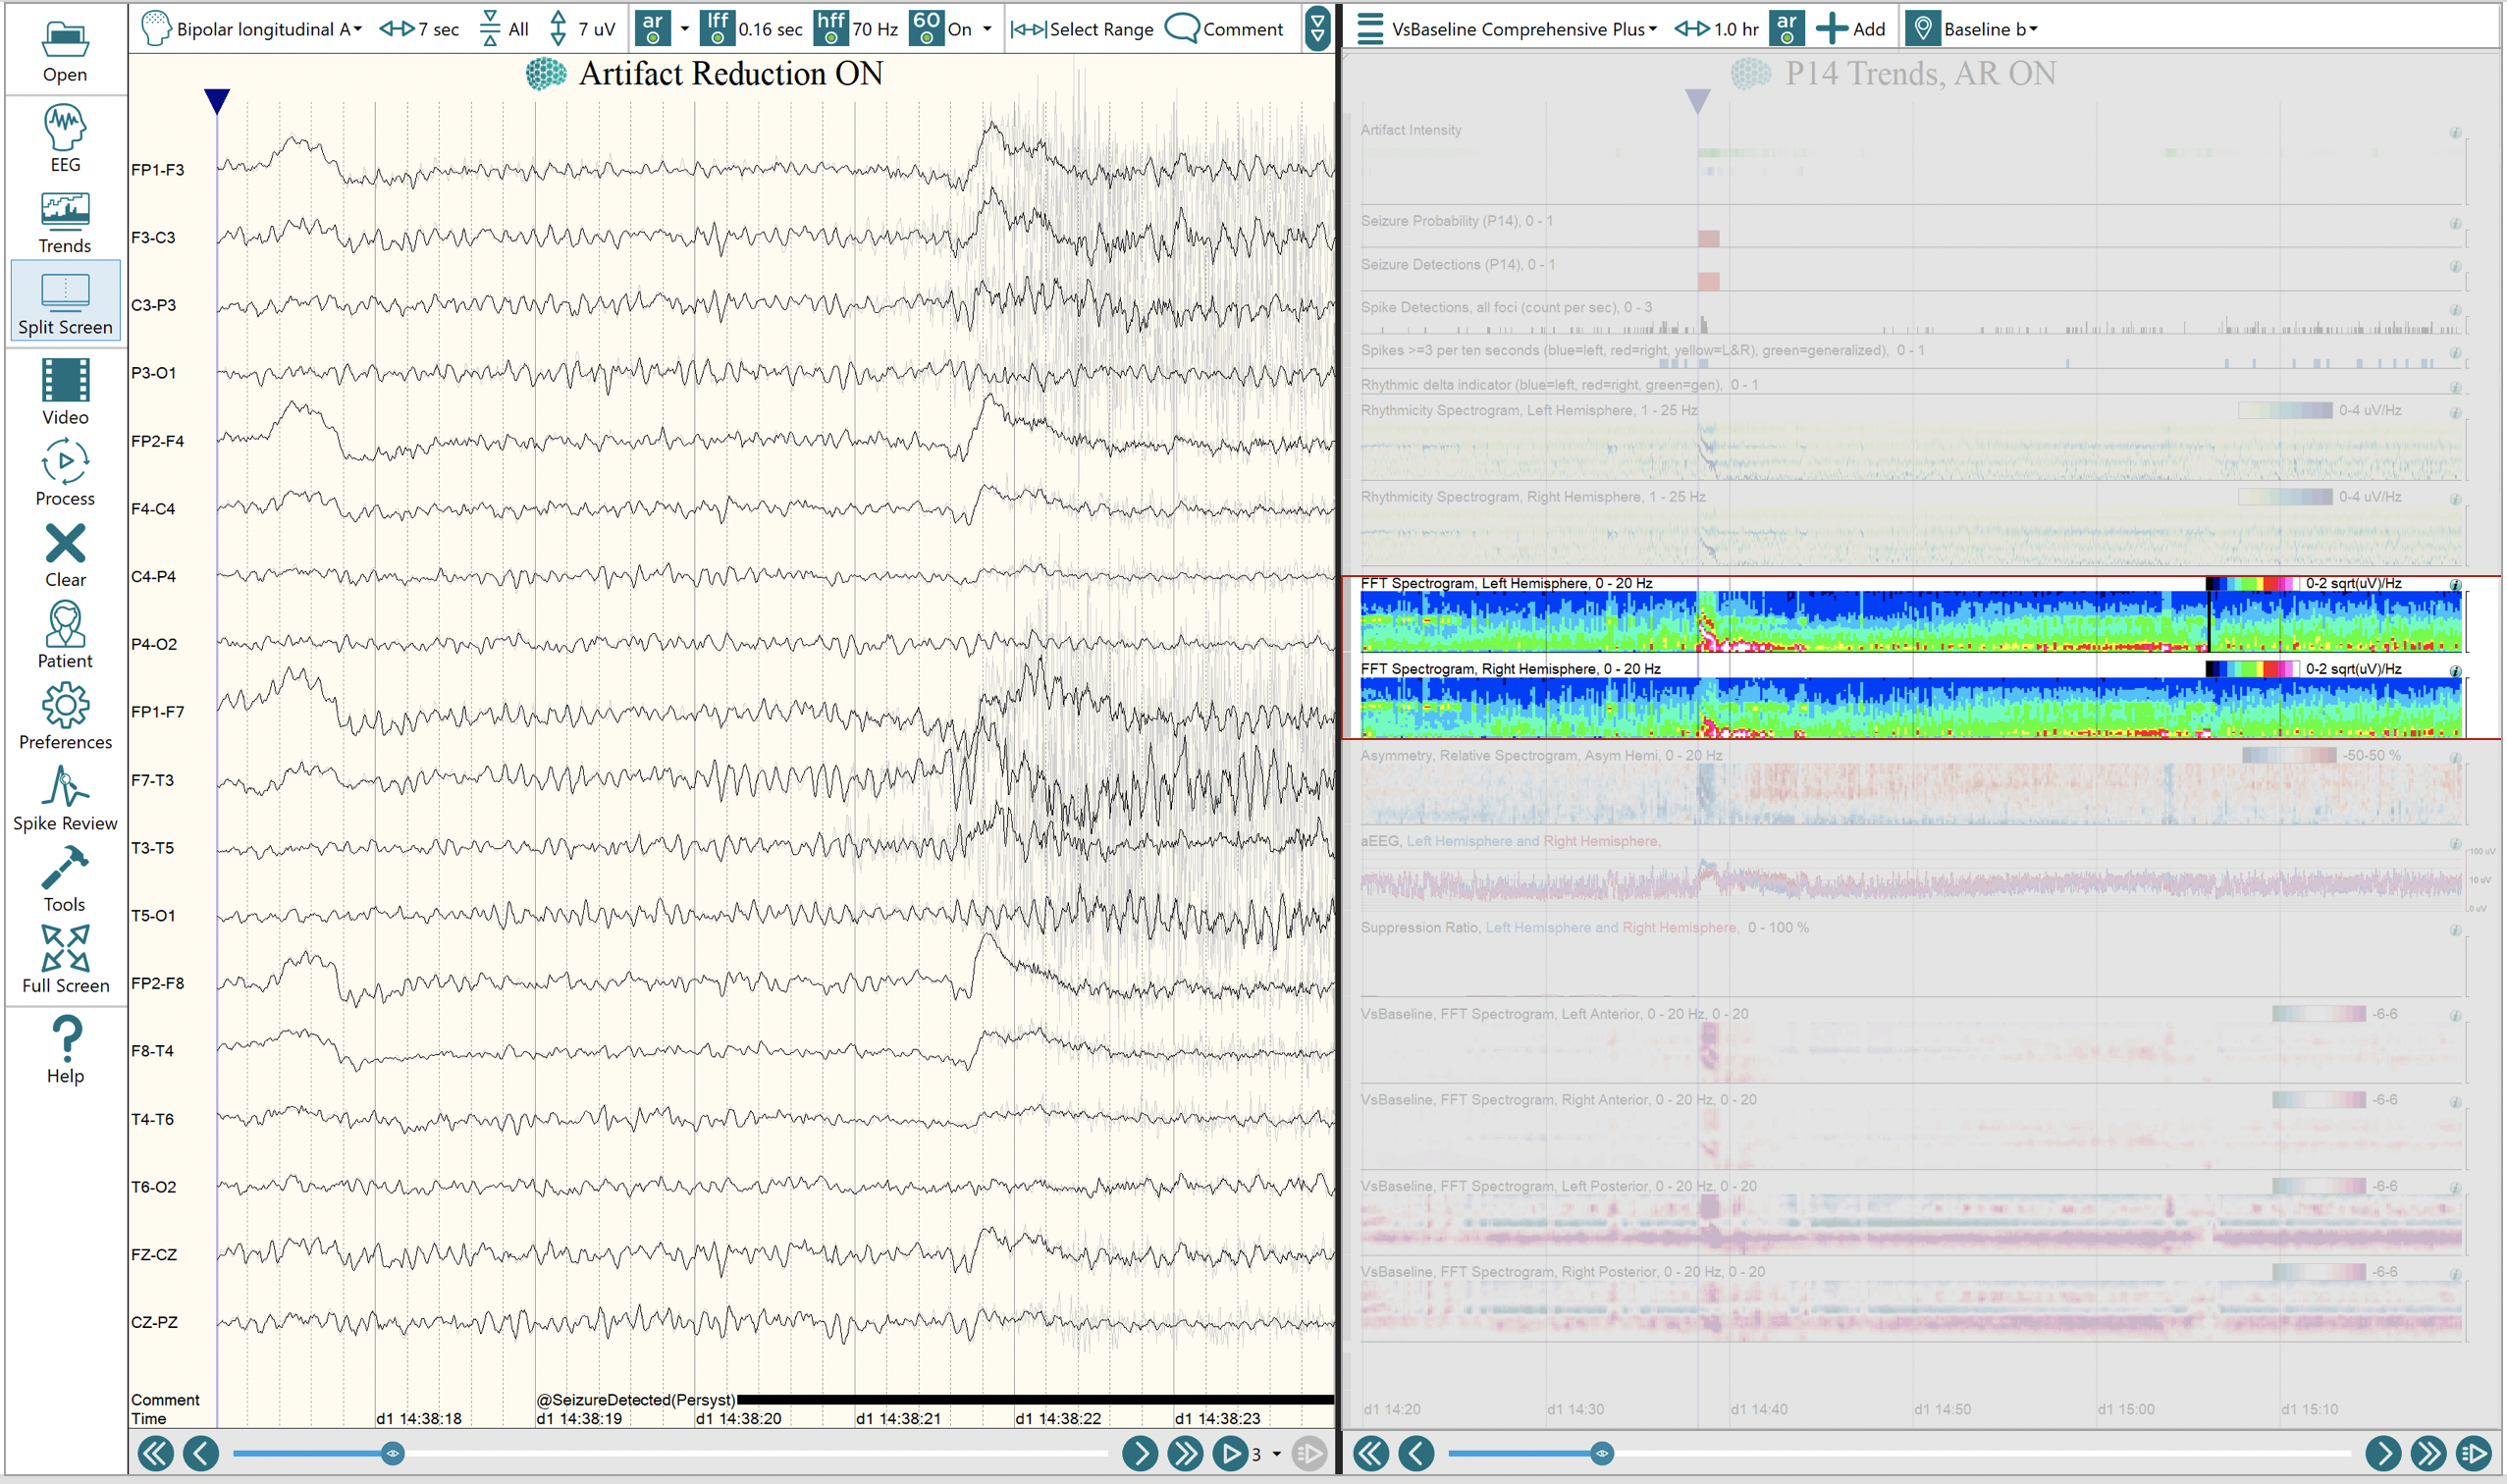
EEG and Trends view where the Trends show a one-hour time frame. The seizure onset is seen in the EEG view, where the Trends view shows the entire course of the seizure and its components.